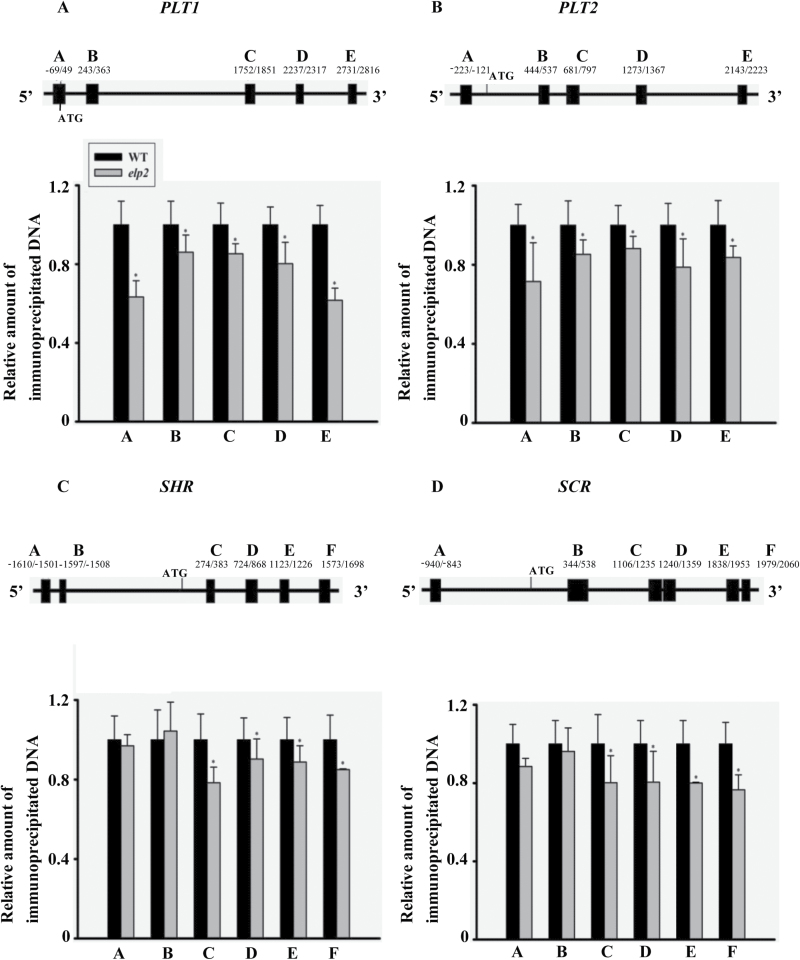
Fig. 8.
Histone H3 acetylation levels in (A) PLT1, (B) PLT2, (C) SHR and (D) SCR. The placement of the primers is indicated. The relative amount of immunoprecipitated chromatin fragments in the elp2 mutant, as determined by qRT-PCR, was compared to that produced in the WT. The data represent mean values with their associated SD (n=3); *, P<0.05.

