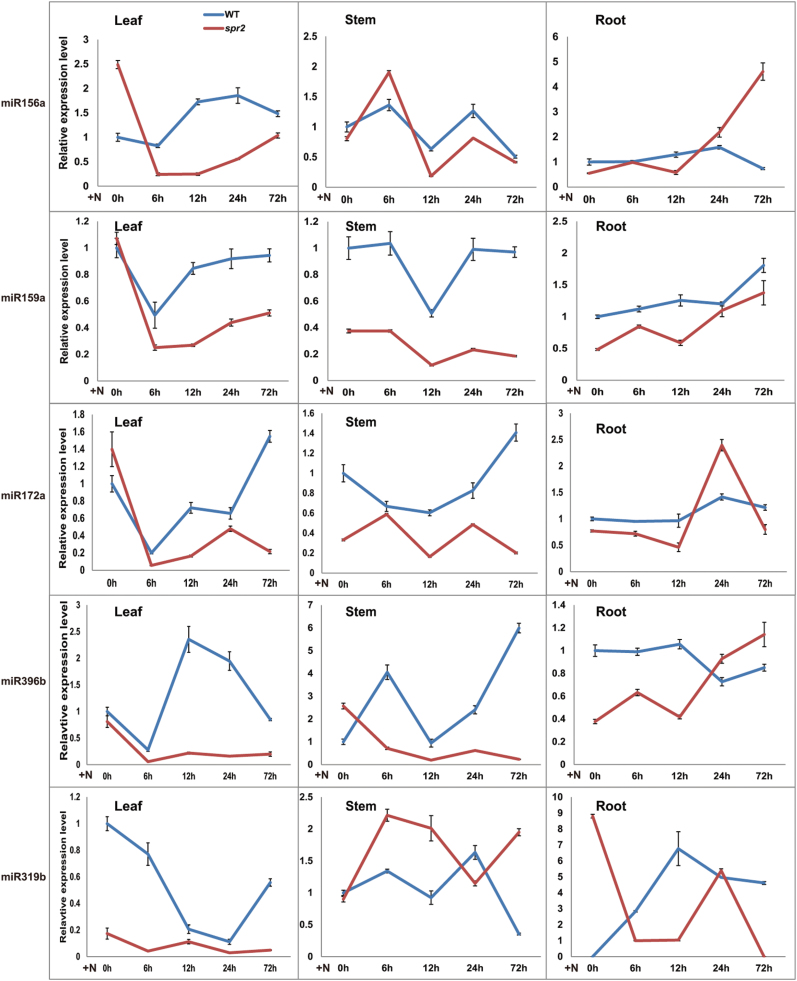
Fig. 3.
Time-course expression profiling of miRNAs (miR156a, miR159a, miR172a, miR396b, and miR319b) from leaves, stems, and roots at 0, 6, 12, 24, and 72h after RKN inoculation (N) in the WT and spr2. At least 10 plants were included in each pool, and three technical replicates were determined for each time point. Error bars indicate ±SE. The primary axis corresponds to the solid line, and the secondary axis corresponds to the dashed line. (This figure is available in colour at JXB online.)

