Fig. 6.
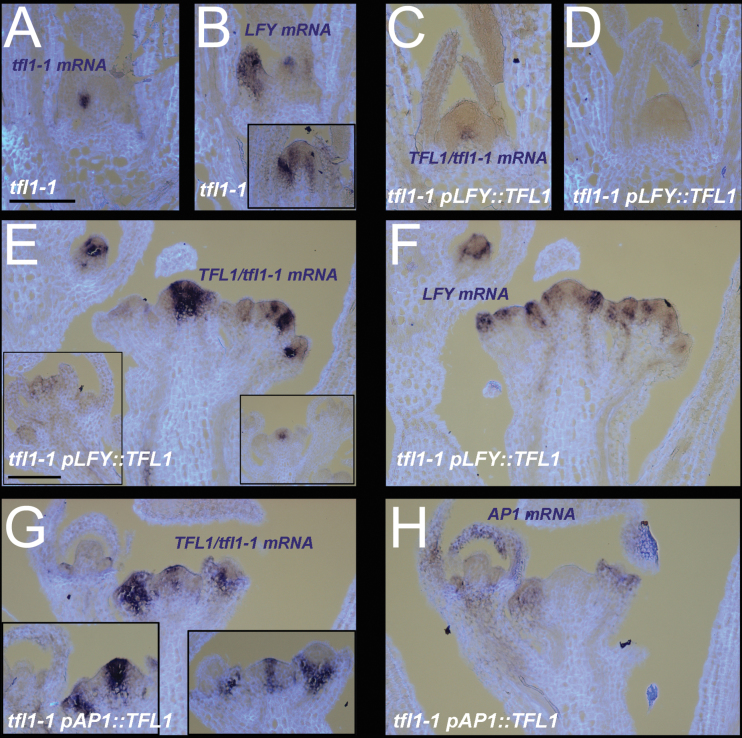
Expression patterns in tfl1 mutant backgrounds. (A, B) Young 10-day-old tfl1 mutants showing tfl1-1 (A) and LFY (B) expression. The insert in (B) shows plants just starting to bolt and ectopically expressing LFY in the shoot. (C, D) Ten-day-old day tfl1 plants containing pLFY::TFL1 showing TFL1/tfl1-1 (C) and absence of LFY (D) expression. (E, F) Older tfl1 plants containing pLFY::TFL1 at 17 d showing TFL1/tfl1-1 (E) and LFY (F) expression. The left insert in (E) shows expression at 20 d in another line in an ap1-like structure. The right insert shows that TFL1 expression is largely limited to the shoot meristem in ap1 mutants. (G, H) At 21 d, tfl1 mutants containing pAP1::TFL1, showing TFL1/tfl1-1 (G) and AP1 (H) expression. Inserts in (G) show other examples. Corresponding mRNA signals seen as a purple stain on pale blue/white tissue background. Scale bars=100 μm.

