Fig. 1.
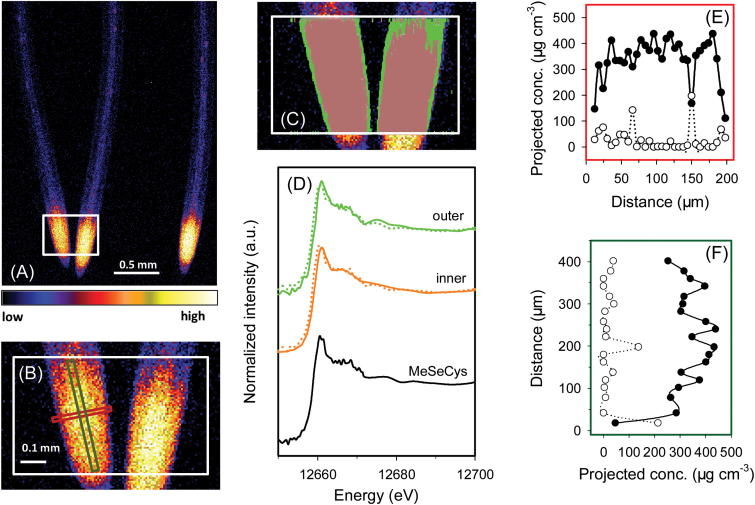
Rice (Oryza sativa L.) roots exposed to nutrient solution containing 1 μM Se(IV) for 1 week. (A and B) Elemental survey maps showing total Se distribution collected in the ‘pre-XANES survey scan’ followed by fluorescence-XANES imaging (‘XANES imaging scan’), with the white box (0.56 mm×0.40mm) indicating the area examined by XANES imaging. (C) The spatial distribution of two pixel populations (outer and inner) identified by comparing energy intensities. (D) Normalized Se K-edge XANES spectra corresponding to the two pixel populations ‘outer’ and ‘inner’ shown in (C) plus the spectrum for MeSeCys. (E and F) Projected volumetric concentrations of C-Se-C compounds (i.e. MeSeCys or SeMet, filled circles) and uncomplexed Se(IV) (open circles) in the latitudinal or longitudinal transects indicated by the red or green rectangle in (B). Dotted lines in (D) show the best fits of reference spectra obtained using LCF as presented in Table 2. Distance in (E) and (F) refers to distance from left to right in the red rectangle and from bottom to top in the green rectangle indicated in (B), respectively. The projected concentrations in (E) and (F) were obtained by multiplying the projected areal concentration by the calculated thickness of the root to obtain the projected volumetric concentration, and multiplying the projected volumetric concentration by the proportion of the Se species (determined for each point using linear combination fitting). Taking into account the concentric structure of roots, concentrations of the Se species in the individual root tissues were calculated in Table 3.

