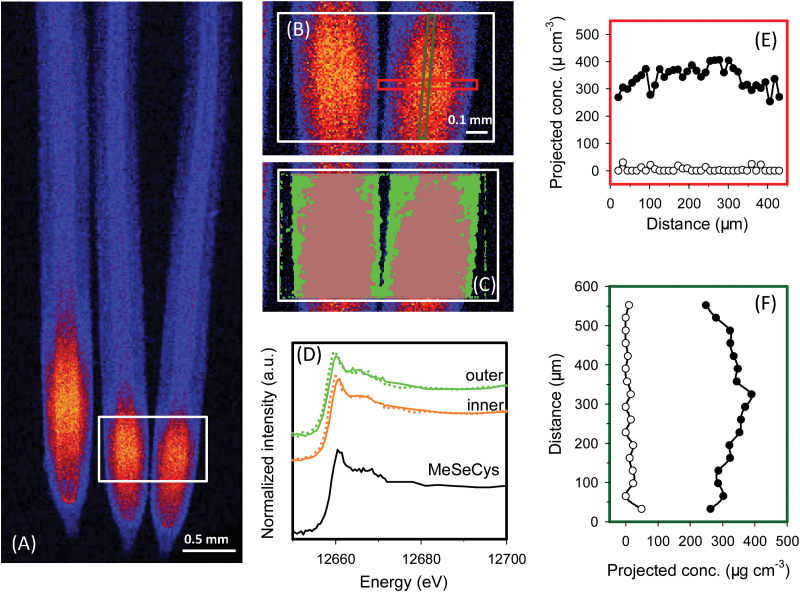
Fig. 2.
Wheat (Triticum aestivum L.) roots exposed to nutrient solution containing 1 μM Se(IV) for 1 week. A full description is given in the legend of Fig. 1. (A and B) Elemental survey maps showing total Se distribution collected in the ‘pre-XANES survey scan’ followed by fluorescence-XANES imaging (‘XANES imaging scan’), with the white box (0.97 mm×0.60mm) indicating the area examined by XANES imaging. (C) The spatial distribution of two pixel populations (outer and inner) identified by comparing energy intensities. (D) Normalized Se K-edge XANES spectra corresponding to the two pixel populations ‘outer’ and ‘inner’ shown in (C) plus the spectrum for MeSeCys. (E and F) Projected volumetric concentrations of C-Se-C compounds (i.e. MeSeCys or SeMet, filled circles) and uncomplexed Se(IV) (open circles) in the cross- and longitudinal transects indicated by the red or green rectangle in (B).

