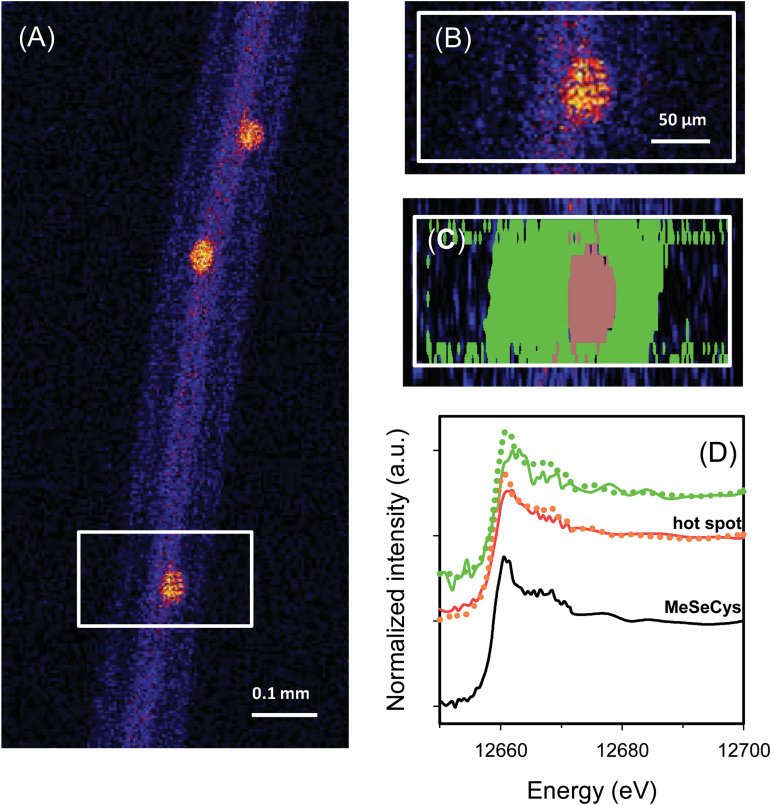
Fig. 3.
The mature primary root (3.0mm from the tip) of rice (Oryza sativa L.), with the lateral root primordium which initiates from the primary root. (A and B) Elemental survey maps showing total Se distribution collected in the ‘pre-XANES survey scan’ followed by fluorescence-XANES imaging (‘XANES imaging scan’), with the white box (0.27 mm×0.15mm) indicating the area examined by XANES imaging. (C) The spatial distribution of two pixel populations (outer tissues and hot spot) identified by comparing energy intensities. (D Normalized Se K-edge XANES spectra corresponding to the two pixel populations ‘hot spot’ and ‘outer tissues’ shown in (C) plus the spectrum for MeSeCys.

