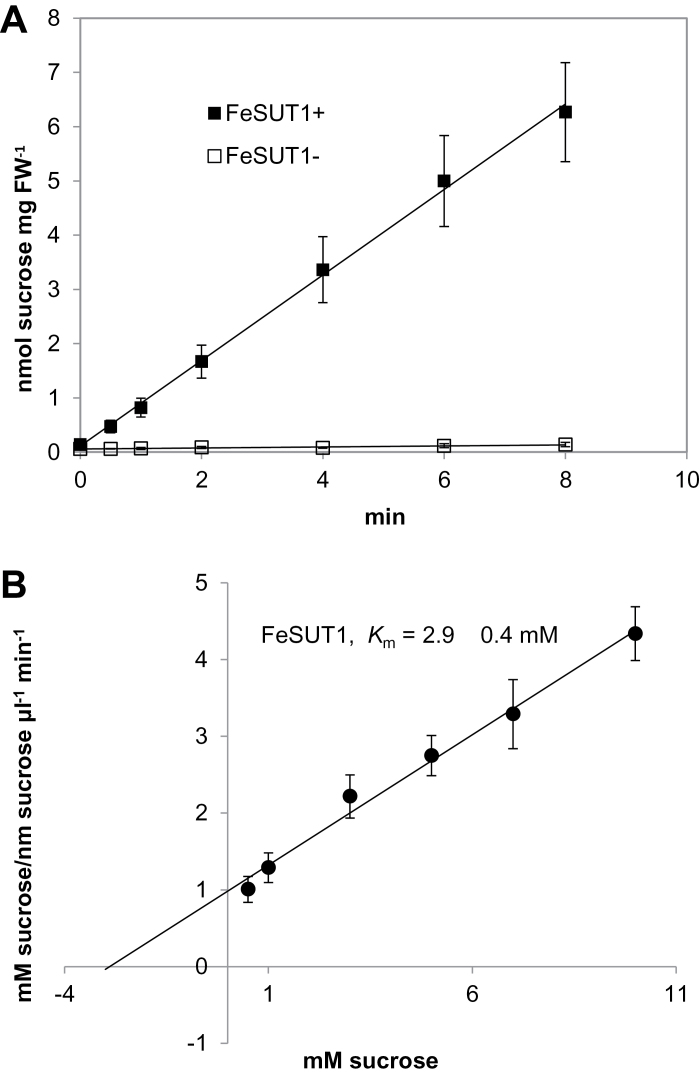
Fig. 1.
(A) Uptake of 14C-sucrose into SEY2102 yeast cells that expressed FeSUT1. The exogenous sucrose concentration was 1mM and measurements were conducted three times with three different transformants. (B) Hanes-Woolf plot for the calculation of the K m-value of FeSUT1. The initial sucrose concentrations to the reaction velocities are plotted against the sucrose concentrations.

