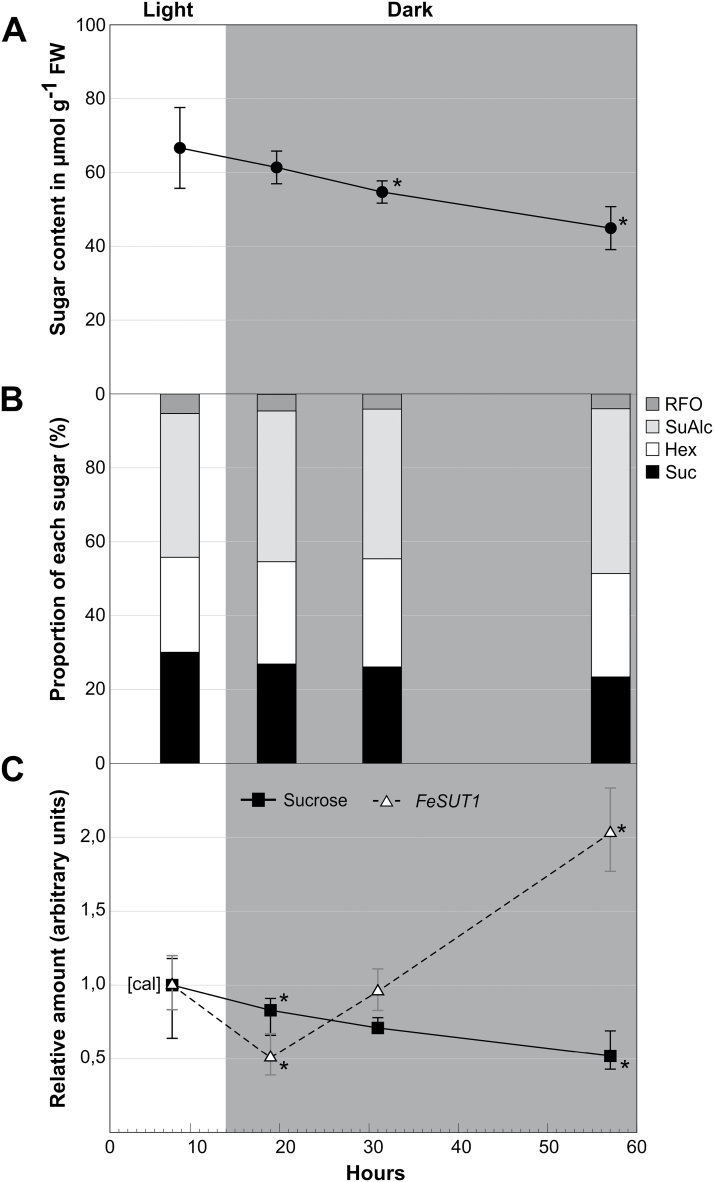
Fig. 6.
Sugar and sugar alcohol content as well as FeSUT1 expression in leaves of F. excelsior in light and during a prolonged dark period. Experiments were performed with three 3-year-old saplings. Leaves were taken in the second half of the normal light period and after 5, 17, and 43h of continuous darkness. (A) Total sugar and sugar alcohol content in leaves. (B) Relative amounts of sugar and sugar alcohol at the total content. (C) Relative sucrose content (■, closed squares, continuous line) and relative expression of FeSUT1 (Δ, open triangles, broken line). Expression levels of FeSUT1 were normalized to actin and values are given as relative expression levels to the first sample of the measurement (calibrator [cal]). Student’s t-test was performed with P ≤ 0.05 to test for significance of changes compared to calibrator [cal]. Hex, hexoses; Mal, maltose; RFO, raffinose-oligosaccharide family sugars; SuAlc, sugar alcohols; Suc, sucrose.

