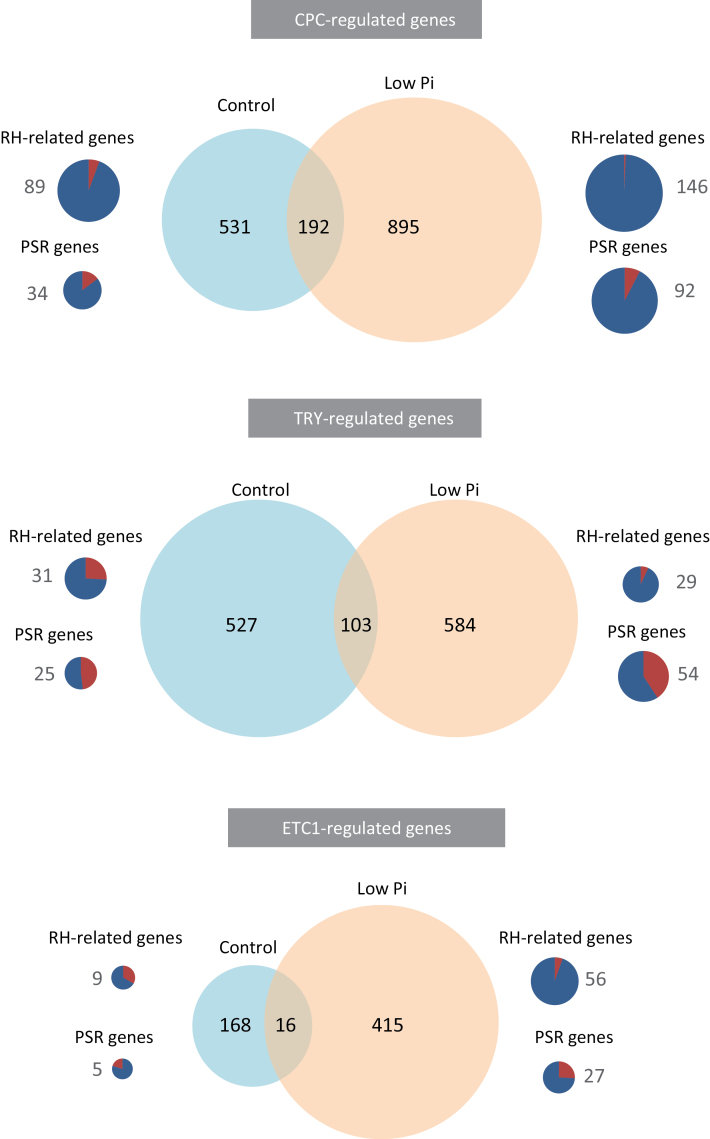
Fig. 2.
Genes differentially expressed between cpc, etc1 and try mutants and the wild-type plants. Pie charts show genes that are preferentially expressed in root hairs (RH; Lan et al., 2013) and in the phosphate starvation response (PSR) genes. Numbers represent gene counts. In the pie charts, red and blue colour represents the percentage of up- and down-regulated genes, respectively. (This figure is available in colour at JXB online.)

