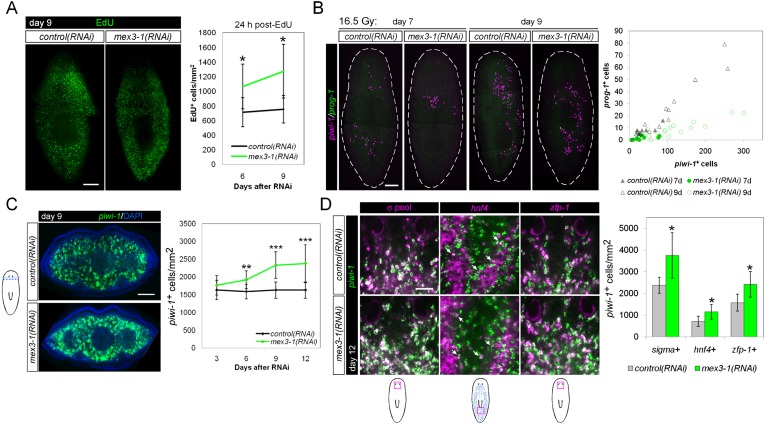
Figure 5. mex3-1(RNAi) animals exhibit expansion of the stem cell compartment.
(A) RNAi worms were administered EdU at 6 or 9 days after RNAi and quantified after a 24-hr period. Counts were performed on whole-animal single confocal planes. (B) mex3-1(RNAi) animals were irradiated with a sublethal dose (16.5 Gy), and stem cells (piwi-1) and progeny (prog-1) were quantified by dFISH at 7 and 9 days after irradiation. The proportion of progeny to stem cells between mex3-1(RNAi) and control worms differed significantly (p < 0.001, analysis of covariance). Whole-animal confocal projections are shown. Each point on the graph represents one animal. (C) Stem cells were quantified in pre-pharyngeal cross sections of intact worms after RNAi by piwi-1 fluorescent WISH (FISH) during phenotypic progression. Single confocal planes at day 9 after RNAi are shown; dorsal, top. (D) Quantification of stem cell subclasses in intact worms 12 days after RNAi. Stem cell subclass was determined by piwi-1 labeling and expression of soxP-1 pooled with soxP-2 (sigma subclass), hnf4 (gamma), or zfp-1 (zeta). Diagrams indicate areas of worms quantified, and arrows indicate example double-positive cells. Scale bars, 200 μm in (A–C) and 50 μm in (D). Error bars represent standard deviation. *p < 0.05, **p < 0.01, ***p < 0.001 (Student's t-test).


