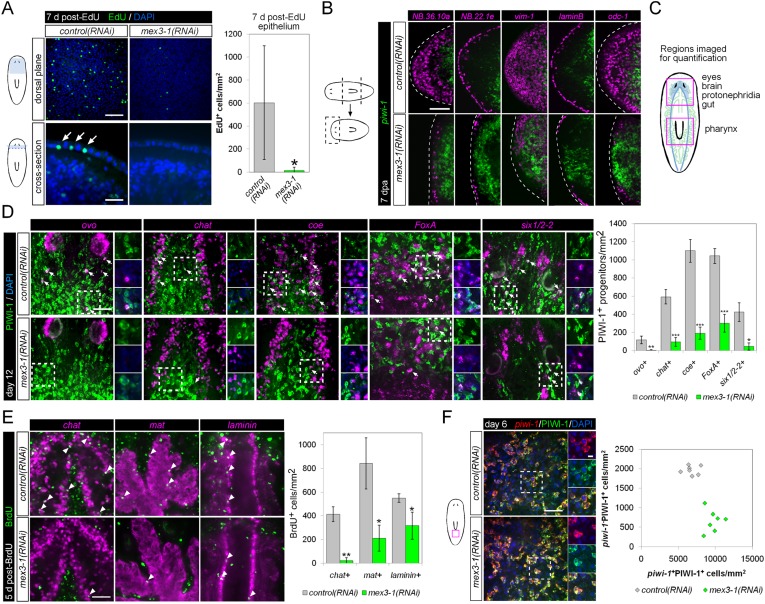
Figure 6. mex3-1 is required for epithelial turnover and regeneration as well as differentiation toward multiple tissues.
(A) RNAi animals were administered EdU 6 days after RNAi, and EdU+ labeling in the epithelium was quantified after a 7-day period. Single confocal planes are shown, with EdU+ cells in the epithelium indicated by arrows. Top panel scale bar, 100 μm; bottom panel scale bar, 50 μm. (B) RNAi animals amputated 7 days after RNAi were analyzed after 7 days regeneration by dFISH for stem cells and epithelial-associated genes. Single confocal planes or projections of head blastemas are shown, with anterior to the left. Dotted lines indicate animal boundary. Scale bar, 100 μm. (C) Diagram indicating regions of animal imaged and examined for quantification of lineage-restricted neoblast progeny. (D) Lineage-restricted progeny populations were quantified in intact worms 12 days after RNAi, using PIWI-1 immunolabeling and FISH for ovo (eyes), chat or coe (brain), FoxA (pharynx), and six1/2-2 (protonephridia). Single confocal planes are shown. Arrows indicate example double-positive cells. Magnified areas are indicated by dashed boxes and inset to the right of each image. Scale bar, 50 μm. (E) RNAi animals were administered BrdU 6 days after RNAi, and BrdU+ labeling in differentiated tissues (chat, brain; mat, gut; laminin, pharynx) was examined after a 5-day period. Single confocal planes are shown. Arrowheads indicate example double-positive cells. Scale bar, 50 μm. Error bars represent standard deviation. *p < 0.05, **p < 0.01, ***p < 0.001 (Student's t-test). (F) Quantification of stem cells (piwi-1+PIWI-1+) and immediate postmitotic stem cell descendants (piwi-1−PIWI-1+) were performed 6 days after RNAi, in head, pre-pharyngeal, and tail regions. Shown are single confocal planes from the tail region. Magnified areas are indicated by dashed boxes. The proportion of postmitotic descendants to stem cells between mex3-1(RNAi) and control worms differed significantly (p < 0.001, non-linear regression analysis). Scale bar, 50 μm on left panels, 10 μm on right panels. All counts were performed in 5–10 animals.


