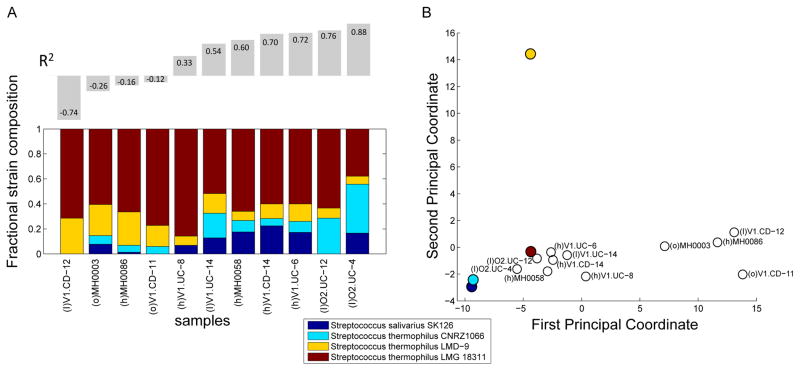
Figure 7. Predicted strain-level population structure within Clostridium sp.
(A) A linear regression analysis was used to model the copy number profile obtained for cluster 110 (Streptococcus thermophilus) in each sample as a combination of known reference genomes, with prediction weights shown as stacked colored bars. Prediction accuracy (R2) is indicated above each bar. Samples with low or negative R2 values potentially contain variation that cannot be explained by any combination of known reference genomes. (B) A principal coordinate analysis depicting the differences between the copy number profiles obtained for this genome cluster in the various samples (open circles), as well as the copy number profiles of reference genomes (filled circles). See also Figure S7.

