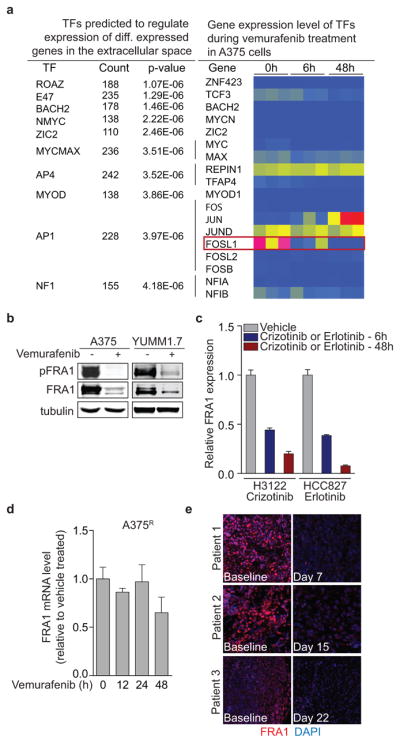
Extended Data Figure 5. Targeted therapy induces down-regulation of FRA1 in drug-sensitive tumour cells.

a, List of transcription factors predicted to regulate the vemurafenib-induced reactive secretome in A375 cells, and a heat map of the corresponding transcription factor gene expression levels in these cells. Red represents high, yellow medium and blue low relative expression on the colour scale. b, Immunoblotting of phosphorylated and total FRA1 protein levels in A375 and YUMM1.7 melanoma cell lines treated with vemurafenib for 24h. c, Relative mRNA levels of FRA1 in H3122 cells treated with crizotinib (500nM) and HCC827 treated with erlotinib (10nM) at different time points (n = 4 technical replicates) d, Relative mRNA levels of FRA1 in A375R cells treated with vemurafenib at different time points (n = 4 technical replicates). e, Immunofluorescence staining of FRA1 (red) and DAPI (blue) in biopsies from melanoma patients before and after vemurafenib treatment (clinical information can be found in Extended Data Table 1).
