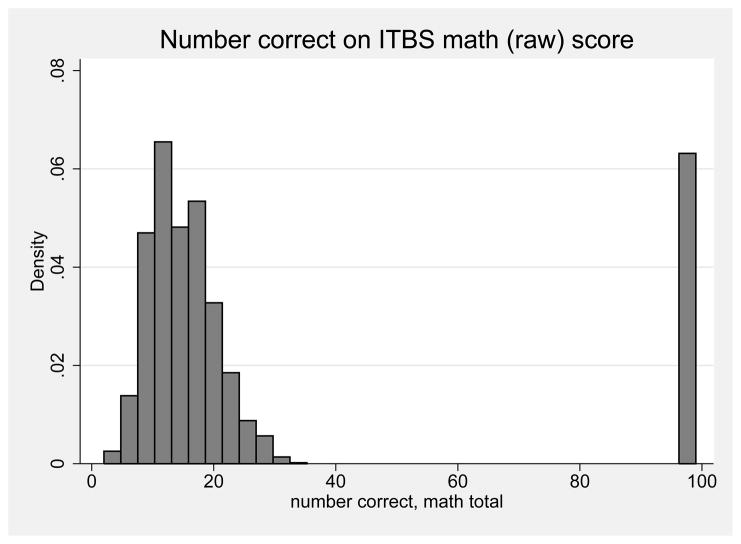
Figure 1.
Histogram of raw ITBS math items correct at baseline.
Notes: Figure shows histogram of raw number of math items correct on baseline ITBS test as reported in the public-use version of the data. The large point mass at 99 represents those individuals with ITBS raw math scores of 99 and associated National Percentile Ranking scores of 0, and represents a missing data code. Data from the New York City School Choice Scholarships Program evaluation conducted by Mathematica Policy Research. Baseline scores unavailable for kindergarten students.

