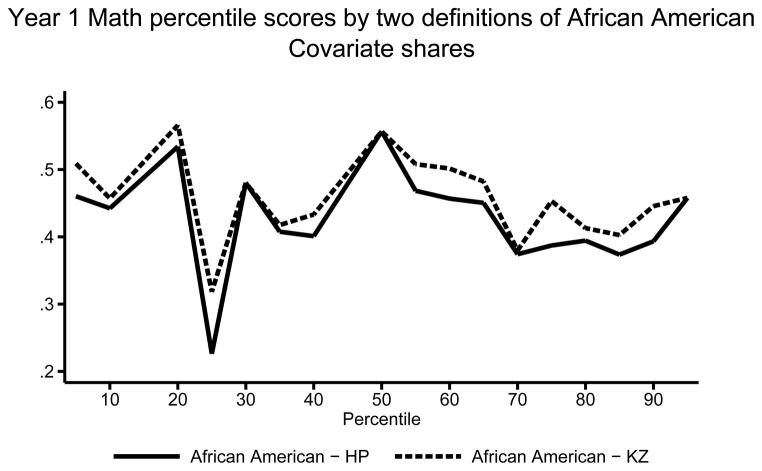
Appendix Figure 5.
Share of each one percentile range of control group test distribution that is made up of African American using either the definition of the Mathematica reports or the definition in Krueger and Zhu
Notes: Figure shows the share of each percentile range of the overall control group pre-random assignment math National Percentile Ranking scores from the Iowa Test of Basic Skills at baseline that is made up of African Americans using the Krueger and Zhu and Mathematica report definitions. For example, the value for the 5th percentile is the weighted share of the observations with test scores larger than the 4th percentile of scores but less than or equal to the 5th percentile of scores that is made of African Americans. Estimates are weighted using inverse propensity score weights. Weights are 1/p̂ for treatment observations and 1/(1 − p̂) for control observations, where p̂ is generated from a logistic regression of treatment status on baseline demographics, sample design variables, and baseline test scores. Data from the New York City School Choice Scholarships Program evaluation conducted by Mathematica Policy Research.

