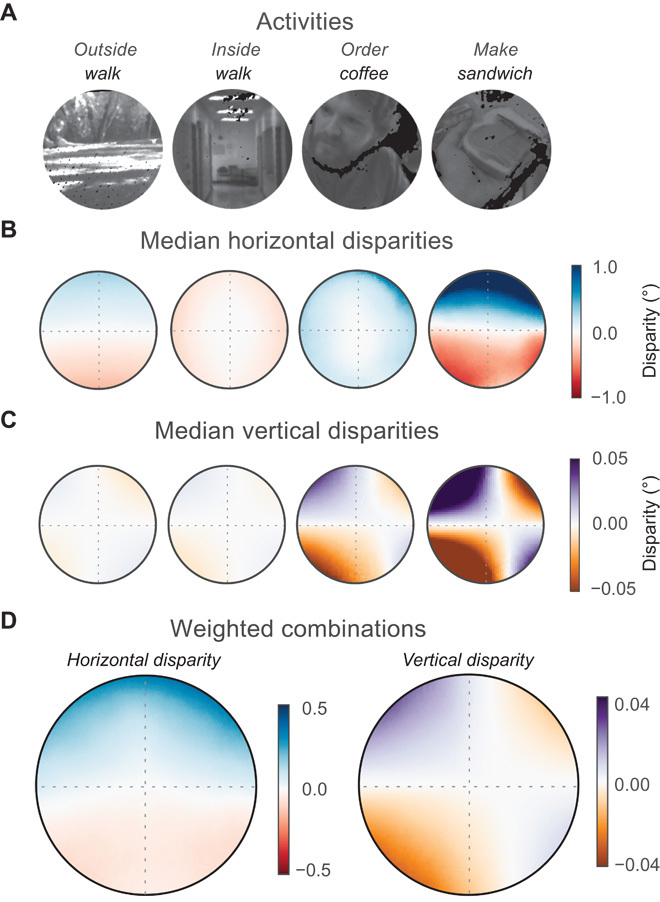
Fig. 4. Median disparities in different parts of visual field for different tasks.

(A) Example frames from the four activities. (B) Median horizontal disparities and visual field position. The circular plots each represent data from one of the four activities averaged across participants. The fovea is at the center of each panel. Radius is 10°, so each panel shows medians for the central 20° of the visual field. Dashed gray lines represent the horizontal and vertical meridians. Uncrossed disparities are blue, crossed disparities red, and zero disparity white. (C) Median vertical disparities and visual field position. Positive disparities are purple, negative disparities orange, and zero disparity white. The panels show the medians for each activity averaged across participants. (D) Weighted combinations. The left panel shows the median horizontal disparities when the four activities are weighted according to ATUS. The right panel shows the combined median vertical disparities. The scales of the color maps differ from the scales for the other panels.
