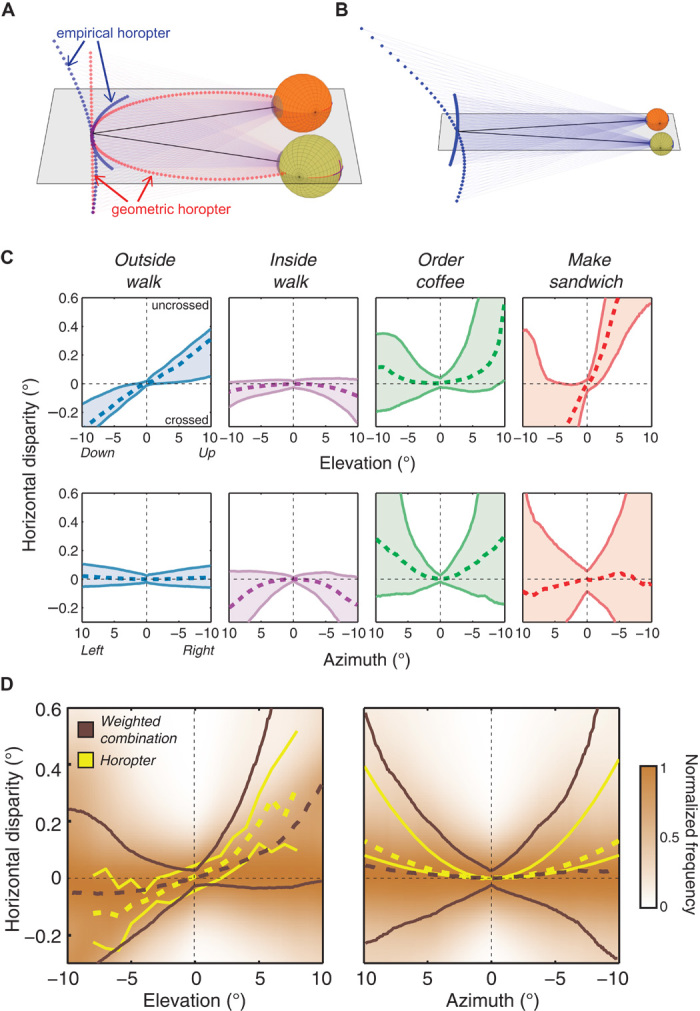
Fig. 6. Natural disparity statistics and the horopter.

(A) Geometric and empirical horopters. Points in 3D space that project to zero horizontal and vertical disparities are shown as a set of red points. The lines of sight are represented by the black lines, and their intersection is the fixation point. The geometric horopter contains points that lie on a circle that runs through the fixation point and the two eye centers (the horizontal horopter or Vieth-Müller Circle) and a vertical line in the head’s median plane (the vertical horopter). Points that empirically correspond are not in the same positions in the two eyes. The projections of those points define the empirical horopter, which is shown in blue. The horizontal part is less concave than the Vieth-Müller Circle, and the vertical part is convex and pitched top-back relative to the vertical line. The disparities associated with the empirical horopter have been magnified relative to their true values to make the differences between the empirical and geometric horopters evident. (B) Corresponding points are fixed in the retinas, so when the eyes move, the empirical horopter changes. Here, the eyes have diverged relative to (A) to fixate a farther point. The horizontal part of the empirical horopter becomes convex, and the vertical part becomes more convex and more pitched. (C) Distributions of horizontal disparity near the vertical and horizontal meridians of the visual field. The upper row plots horizontal disparity as a function of vertical eccentricity near the vertical meridian. The lower row plots horizontal disparity as a function of horizontal eccentricity near the horizontal meridian. The columns show the data from each of the four tasks averaged across participants. The colored regions represent the data between the 25th and 75th percentiles. The dashed lines represent the median disparities. (D) Weighted-combination data and the empirical horopter. The left panel shows the weighted-combination data and the horopter near the vertical meridian; horizontal disparity is plotted as a function of vertical eccentricity. The right panel shows the data and horopter near the horizontal meridian; horizontal disparity is plotted as a function of horizontal eccentricity. The brown lines represent percentiles of the natural disparity data: dashed lines are the medians, and solid lines are the 25th and 75th percentiles. The yellow lines represent the same percentiles for the horopter. The horopter data in the left panel come from 28 observers in (31). The horopter data in the right panel come from 15 observers in (23, 35, 42, 52). We computed the probability density of natural disparities at each eccentricity, and these distributions are underlaid in brown, with the color scale normalized to the peak disparity at each eccentricity.
