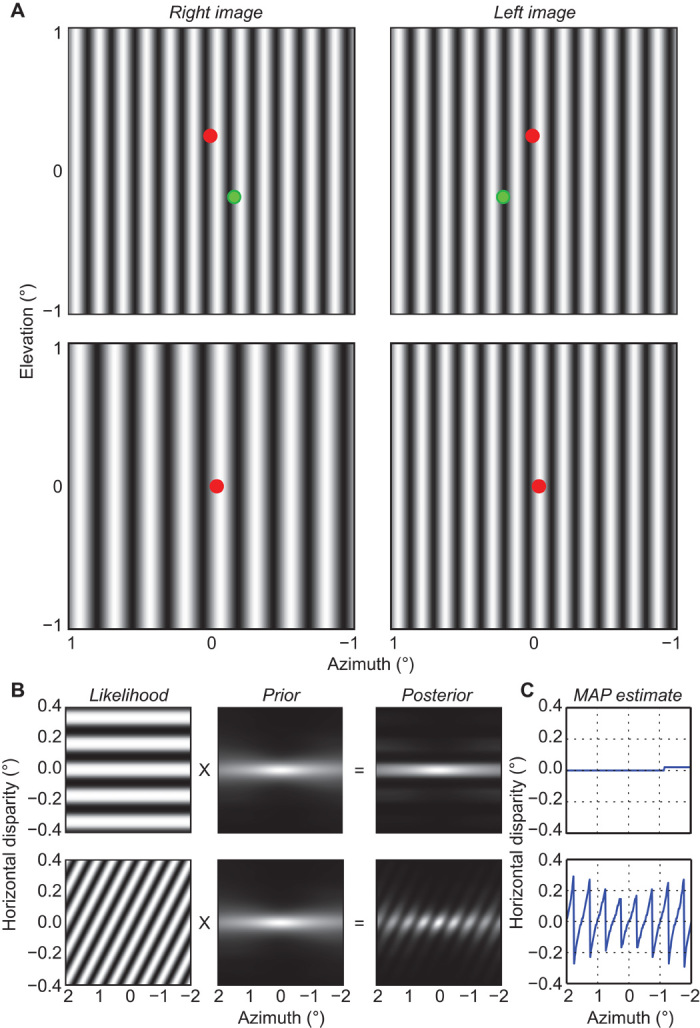
Fig. 7. Wallpaper illusion and venetian blinds effect.

(A) Upper part shows the wallpaper illusion. Vertical sinewave gratings of the same spatial frequency and contrast are presented to the two eyes. Cross-fuse the red dots to see the stimulus stereoscopically. Notice that the stimulus appears to lie in the same plane as the fused red dot. Now cross-fuse the green dots and notice that the stimulus now appears to lie in the same plane as the fused green dot. The lower part shows the venetian blinds effect. Vertical sinewave gratings of different spatial frequencies are presented to the two eyes (fR/fL = 0.67). Cross-fuse the red dots to see the stimulus stereoscopically. Hold fixation steady on the fused red dot and notice that the stimulus appears to be a series of slanted planes. (B) Likelihood, prior, and posterior distributions as a function of azimuth; elevation is zero. The upper row shows the distributions for the wallpaper stimulus and the lower row the distributions for the venetian blinds stimulus. The grayscale represents probability, brighter values having greater probability. (C) MAP estimates for wallpaper (upper) and venetian blinds (lower). Note the change in the scale of the ordinate relative to (B). If one wanted to visually match the stimuli in A to the units in B and C, the correct viewing distance is 148 cm, so that the stimuli subtend approximately 2×2°. Note that A shows only a portion of the stimuli used to compute the results.
