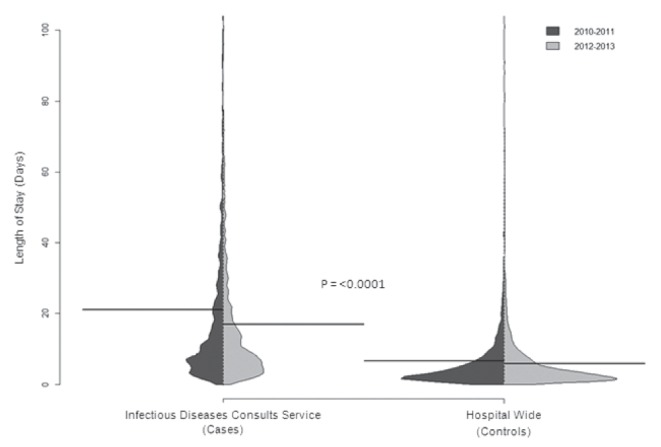
Figure 1).

Violin plot illustrating the distribution of length of stay (LOS) in the infectious diseases consult service cohort (cases and the hospital-wide cohort [controls]) pre and post introduction of the infectious diseases physician assistant. The average LOS in each group is illustrated with the bold black line. The differential change in LOS in the cases and the controls is statistically significant (P<0.0001)
