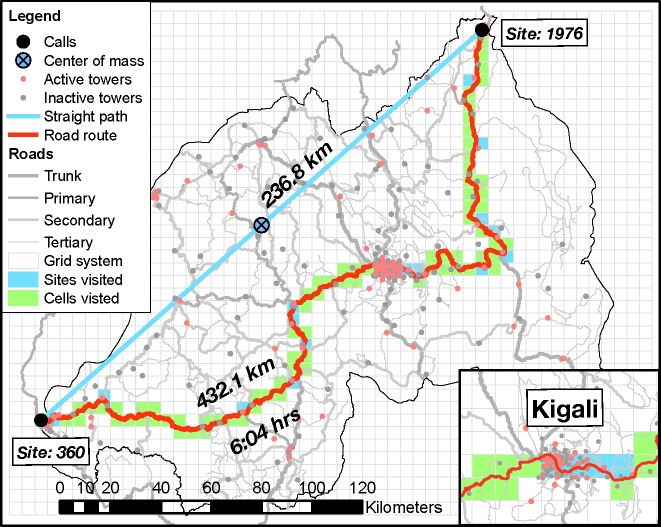
Fig 1. Map of the monthly spatiotemporal trajectory of the caller with the largest monthly RoG.
This caller which we refer to as 𝓟 made two calls in October 2005: the first one from a cellular tower located in the grid cell labeled “Site 1976” and the second one from a cellular tower located in the grid cell labeled “Site 360.” There are 2040 5km x 5km grid cells indexed from 1 (the cell in the lower left corner) to 2040 (the cell in the upper right corner). A site is a grid cell that contains at least one cellular tower. The map shows the location of the straight path between sites 1976 and 360, and also the location of the quickest road route—the road route with the smallest estimated travel time—between the two sites. The straight path between the two towers used by 𝓟 is 236.8 km long, while the straight line path between the centroids of sites 1976 and 360 is 237.2 km long. The quickest road route between the centroids of sites 1976 and 360 is 432.1 km long. The estimated travel time along this route is 6 hours and 4 minutes. The map also shows the center of mass required for the calculation of RoG which is located in the middle of the straight path, as well as Rwanda’s borders, Rwanda’s road network structure with trunk, primary, secondary and tertiary roads, and the locations of the all the 239 cellular towers references in the Rwandan CDRs. We note that only 78 of these towers were active (i.e., handled at least one communication) in October 2005. The grid cells that contain at least one active tower in October 2005 are referred to as sites for that month. The visited sites associated with the spatiotemporal trajectory of 𝓟 are the sites which are intersected by the quickest road route between sites 1976 and 360. There are 19 visited sites which are shown in blue. All the grid cells intersected by this route are called visited cells. The visited cells that are not visited sites are shown in green. The inset shows the capital Kigali and its surrounding area. This is the region with the highest cellular tower density in Rwanda. The Rwandan road network is publicly available data under the Open Database License, and comes from OpenStreetMap (openstreetmap.org), a global open-source mapping project.

