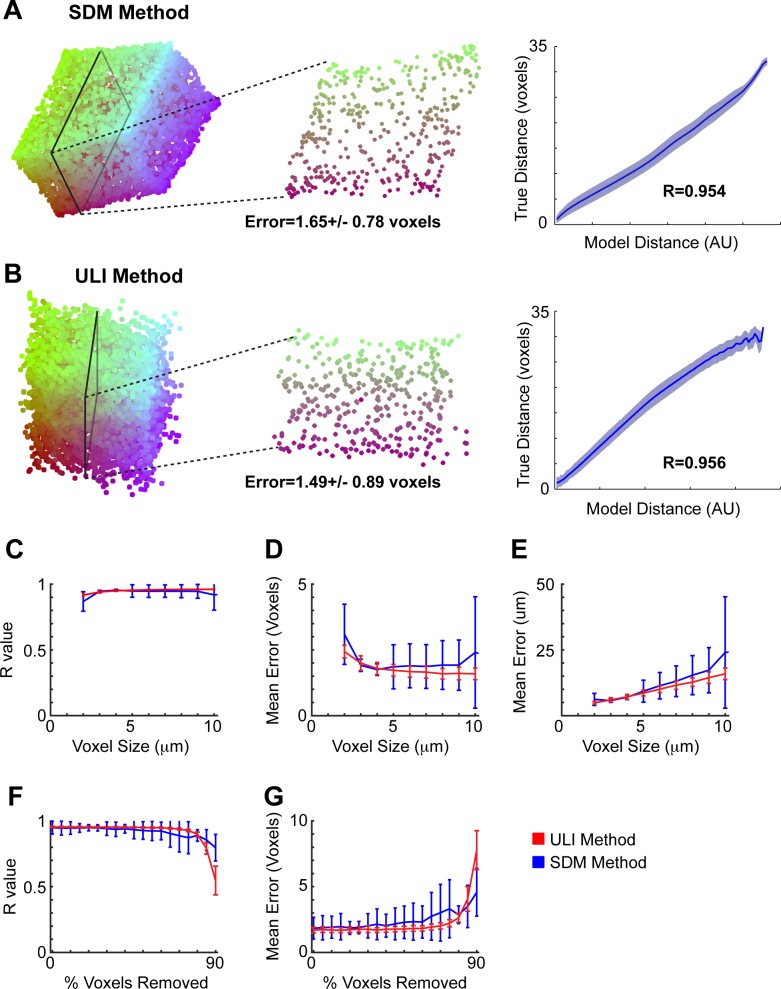
Fig 3. Neural Voxel Puzzling Performance.
(A) On the left, an example reconstruction of voxel locations using the SDM method. Colors are based on initial locations: those with a larger initial x location are redder, while those with a larger initial y location are bluer. In the middle, a 2-dimensional slice through reconstructed volume. The distance errors are calculated following scaling and rotating the reconstructed volume to match the original volume. On the right, one metric for the accuracy of reconstruction is shown by plotting the reconstructed distances between all points against their true distances for the reconstruction in this panel. The mean plus/minus the standard deviation (shaded) is shown. A perfect reconstruction would be a straight line, corresponding to an R value of 1. (B) Same as panel A, except an example reconstruction using the ULI method. (C) R values for simulations using the SDM method (blue) and ULI method (red), as a function of the voxel size. While voxels were not confined to be cubes, for ease of understanding, we report voxel sizes as the edge length of the cube corresponding to the average voxel size. Error bars represent the standard deviation across simulations in each panel. (D) Mean distance errors in voxels for both methods as a function of the voxel size. (E) Mean distance errors in microns for both methods as a function of the voxel size. (F) Voxels are removed to represent voxels that do not contain location information (such as voxels that contain a single cell body). R values for simulations using both methods are plotted as a function of the percentage of voxels removed. (G) Mean distance errors are plotted as a function of the percentage of voxels removed.

