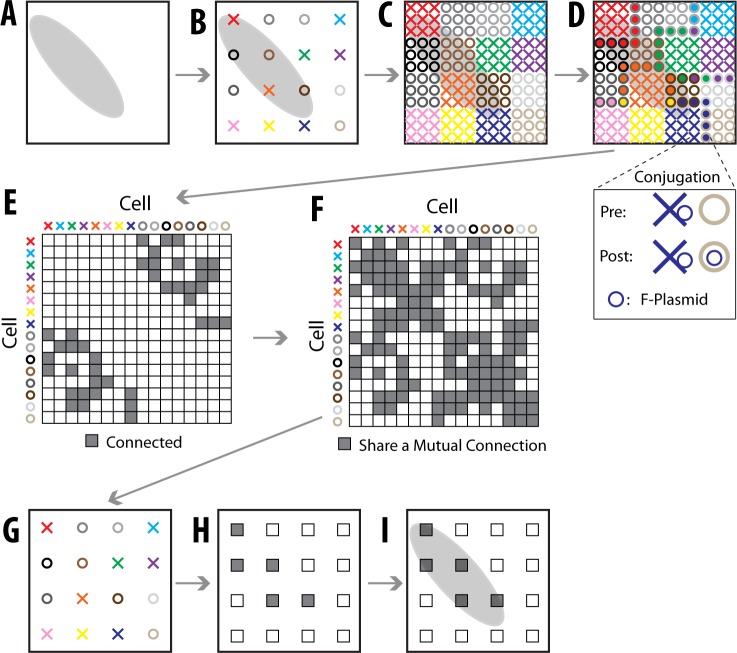
Fig 6. Chemical Puzzling Overview.
(A) An example area contains a chemical whose concentration is represented by a grayscale value. (B) Pioneer cells (X’s and O’s, each with a different color) are put on the plate. X’s represent F+ cells that can transfer an F-plasmid into an F− cell (O’s). (C) The pioneer cells replicate and spread. Descendants of a pioneer are shown in the same color. (D) When the cell colonies become large enough to contact neighboring colonies, the F+ cells (X’s) will copy the F-plasmid and transfer it to the F− cells (O’s). This is shown as the X’s color filling in the center of the O’s. In the inset (below), the F-plasmid transfer (conjugation) is shown. (E) The DNA is sequenced to determine which pioneer cells are “connected” (which had a conjugative transfer occur between their colonies). A connectivity matrix is made from this data. (F) The matrix of connections doesn’t directly provide accurate information about how close the original cells are to each other because O’s can’t be connected to O’s (and same for X’s). As our similarity matrix, we thus use the matrix of mutual connections, which allows O’s to be connected to O’s. (G) The location of the original cells is estimated from the matrix in panel F. (H) The chemical concentrations at each of the original cells locations is known as the cells’ DNA acts as a chemical sensor. (I) The chemical concentration everywhere is extrapolated based on the chemical concentrations at the known pioneer cells.

