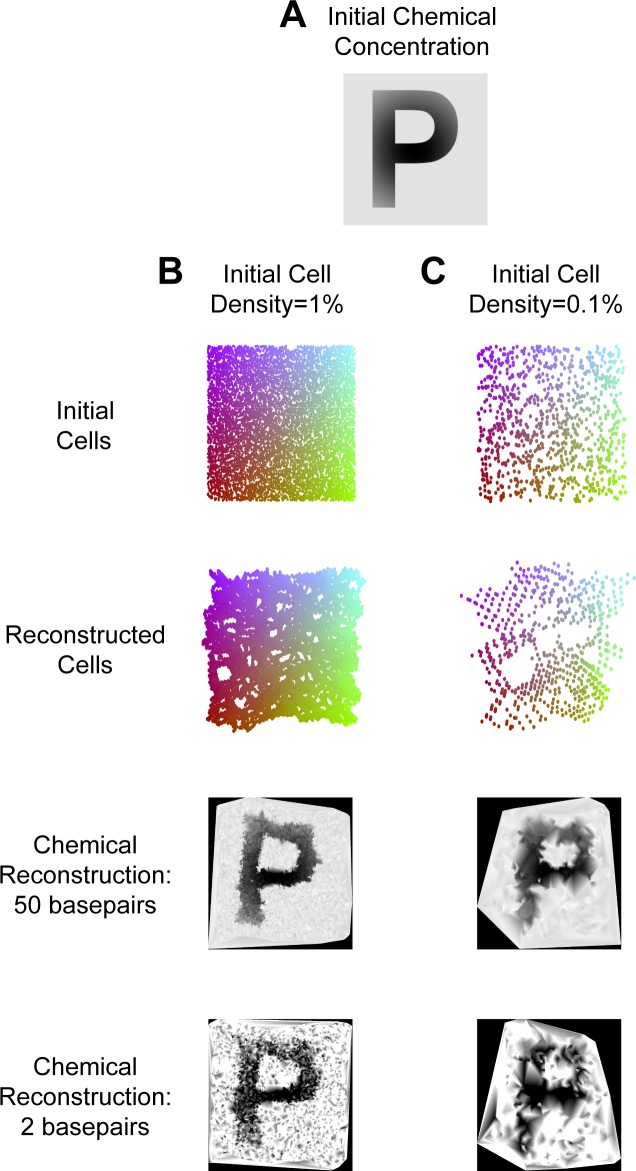
Fig 7. Chemical Puzzling Performance.
(A) The chemical concentration across the plate. It is described by the letter “P,” with the concentration decreasing moving outwards from the center, and a constant background concentration. (B) A simulation is done with an initial cell density of 1%. (C) A simulation is done with an initial cell density of 0.1%. For panels B and C, the top row shows the initial locations of the pioneer cells. They are color-coded by location. The second row shows example reconstructed locations of the pioneer cells. The third row shows the reconstructed chemical concentrations when 50 base pairs are used to detect the concentration. The bottom row shows the reconstructed chemical concentrations when 2 base pairs are used to detect the concentration. Note that the black border represents regions of unknown concentration.

