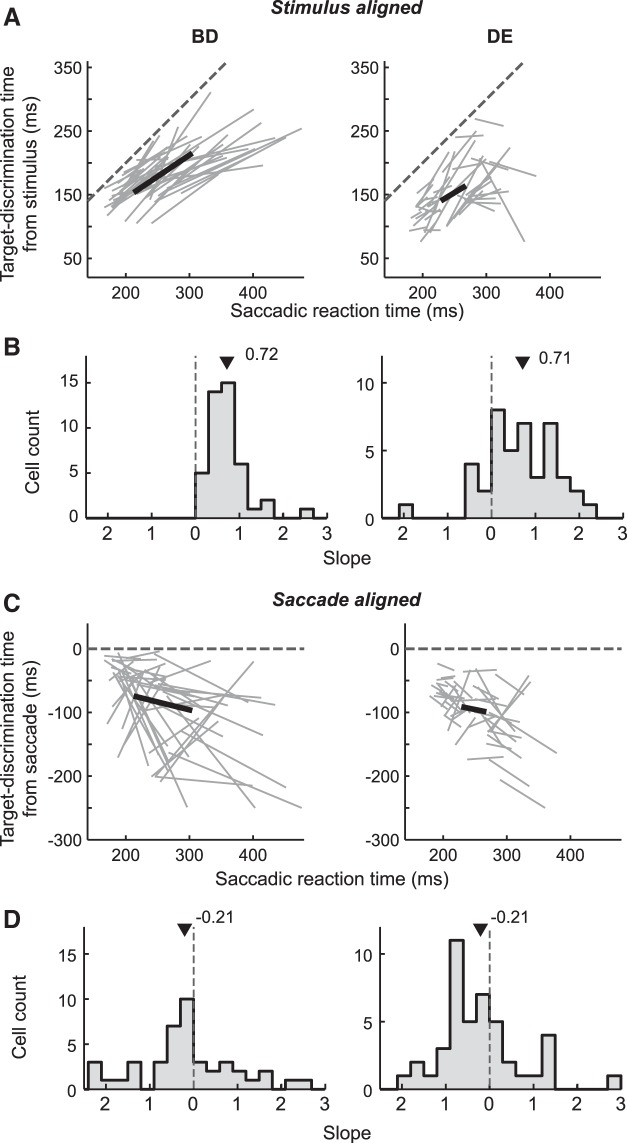
Fig. 7.
Covariability between target-discrimination time and saccadic reaction time. A: relationship between the target-discrimination time in the stimulus-aligned activity and the saccadic reaction time of each of the 44 neurons. The target-discrimination time in the Bright-Difficult (left) and Dim-Easy (right) conditions, respectively. Each gray line indicates 1 neuron, the thick black line indicates the population mean among neurons, and the dotted line indicates unity. B: distributions of the slopes of the line segments in A. Triangles indicate the means; the slope distributions differed significantly from 0 (Wilcoxon signed-rank test, P < 0.0001) and 1 (P < 0.01) in both stimulus conditions. C, D: relationship between target-discrimination time in saccade-aligned activity and the saccadic reaction time. The slope distributions were significantly smaller than 1 in both stimulus conditions (Wilcoxon signed-rank test, P < 0.0001). The difference from 0 was not significant in the Bright-Difficult condition (P = 0.17) and marginally significant in the Dim-Easy condition (P = 0.024).

