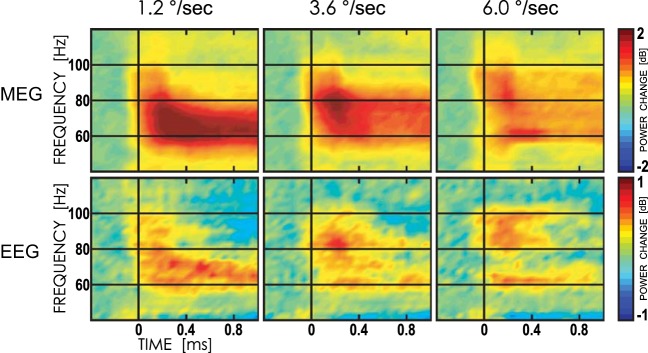
Fig. 2.

Grand average time-frequency plots of gamma power changes (in dB) elicited by gratings drifting at 1.2, 3.6, and 6.0°/s. Top: magnetoencephalographic (MEG) sensors with maximal gamma response (MEG2112 and MEG2113). Bottom: electroencephalographic (EEG) channel Oz. Note different scales for MEG and EEG.
