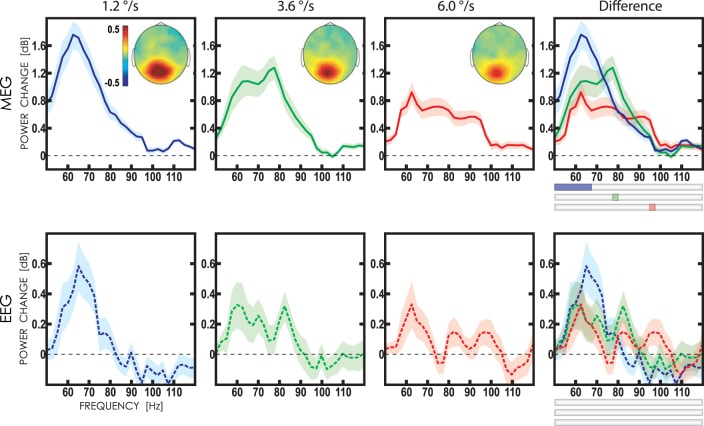
Fig. 4.
Gamma responses to moving gratings measured with MEG (sensors MEG2112-MEG2113; top) and EEG (Oz derivation; bottom). Grand average spectra of normalized gamma power are shown for the three stimulus velocities: ”slow“ (1.2°/s; blue line), ”medium“ (3.6°/s; green line), and ”fast“ (6°/s; red line). The shadows mark 95% confidence intervals. The ”velocity-specific“ gamma frequencies (P < 0.05, corrected for multiple comparisons) are marked at top far right by the corresponding color on the horizontal bars. Insets show spatial distribution of the mean MEG gamma power (in dB) in the 50- to 120-Hz range.

