Fig. 4.
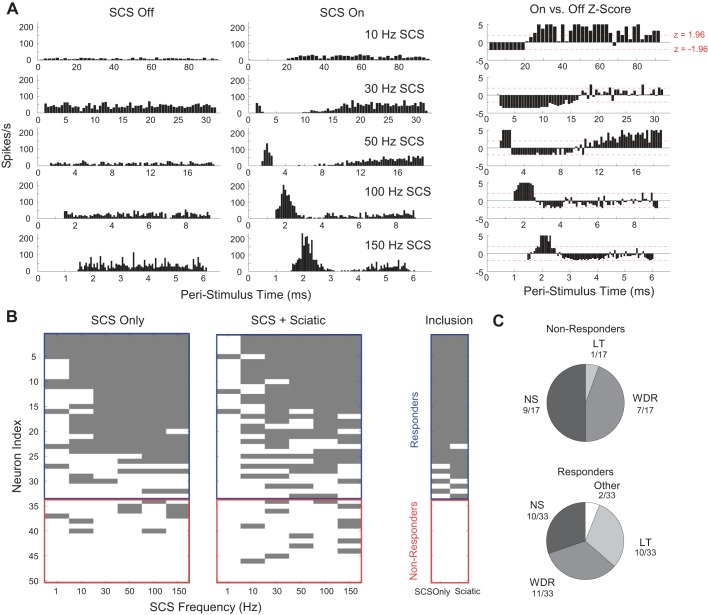
Analysis of poststimulus time histograms (PSTHs) was used to differentiate responders to SCS from nonresponders. A: representative peristimulus responses during SCS Off (left) and SCS On (middle) during 10-, 30-, 50-, 100-, and 150-Hz SCS. Normalization of the SCS On response to the SCS Off response using Z-scores (right) was used to determine if a response to SCS was significant. B, left: responder/nonresponder, sorted by incidences of significant peristimulus responses, with individual significant responses highlighted in gray. A neuron was classified as a responder if the Z-score result from 2 or more contiguous frequencies in either the SCS only or SCS + sciatic condition was significant. Neurons for which Z-score analysis could not be conducted due to low firing rates but for which Kolmogorov-Smirnoff tests yielded significant responses were included. B, right: map of neurons that were included in firing rate (Fig. 5), principal component, and clustering analyses (Fig. 6). Only individual frequency-response relationships that met the contiguous frequency criterion were included in principal component analysis (PCA) and clustering. C: distribution of LT, WDR, and NS neurons among nonresponders (top) and responders (bottom).

