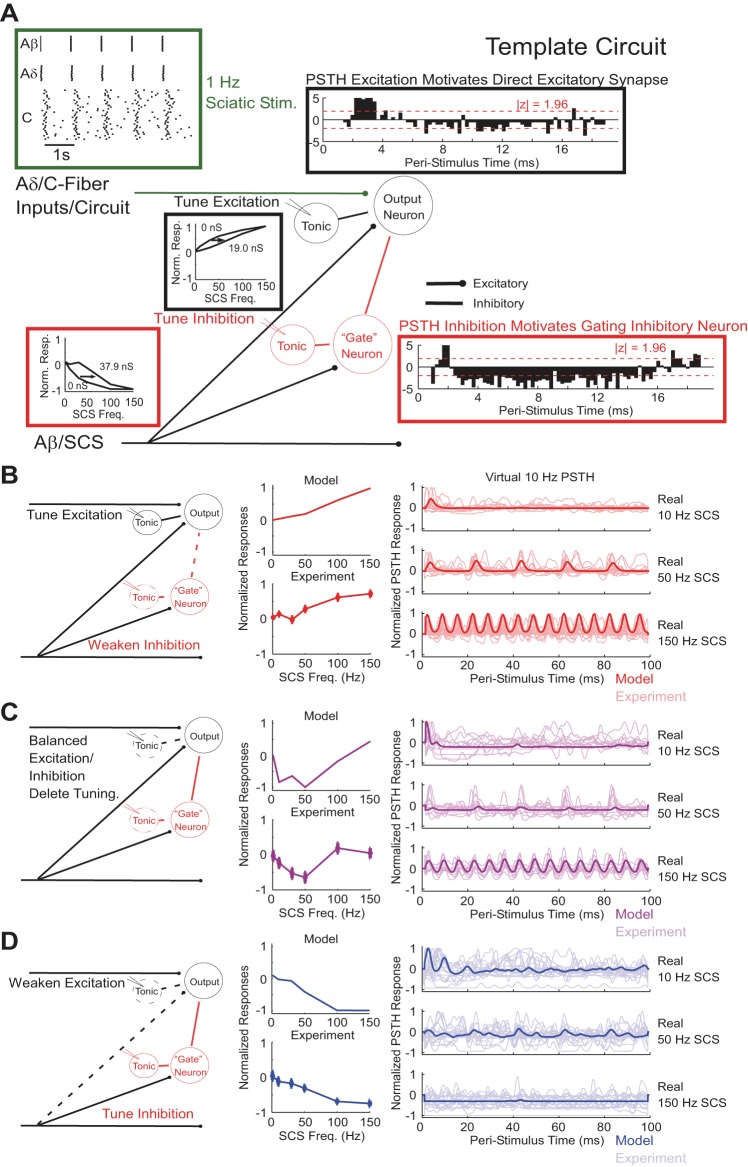
Fig. 8.
Computational models of spinal microcircuits reproduced frequency-response curves and features of PSTHs. A: template circuit that describes all features that contributed to the individual microcircuits. B–D: individual spinal microcircuits, normalized frequency-response relationships, and normalized smoothed PSTHs constructed using a “virtual” 10-Hz SCS train time-aligned onto real 10-, 50-, and 150-Hz SCS comparing model and experimental responses. In PSTH comparisons, the model response (bold) was overlaid onto all experimental PSTH responses (faint) from neurons whose frequency-response relationships were classified into the cluster corresponding to the microcircuit. The colors of the graph lines indicate the cluster to which each microcircuit corresponds (Fig. 6).

