
Fig. 8.
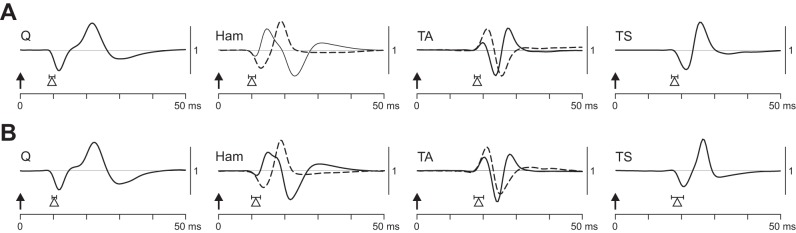
Characteristic EMG waveforms and onset latencies of PRM reflexes. A: responses to 2-Hz stimulation. B: responses from patterns of periodic amplitude modulation. Arrows indicate times of stimulus delivery; EMG waveforms are exemplary and were characteristic across subjects. Triangles represent onset latencies averaged over all available data sets and subjects; horizontal lines show SE. Two characteristic waveforms were found in Ham and TA. A: data derived from Q, subject 4, 0+ 3−, 8 V; Ham, subject 8, 0+ 3−, 4 V (solid line) and subject 2, 0+ 3−, 5 V (dashed line); TA, subject 8, 2+ 3−, 5 V (solid line) and subject 2, 0+ 2−, 6 V (dashed line); and TS, subject 4, 1+ 3−, 9 V. B: data derived from Q, subject 4, 0+ 3−, 11 Hz, 5 V; Ham, subject 2, 0+ 3−, 16 Hz, 4 V (solid line) and subject 8, 1+ 3−, 16 Hz, 4 V (dashed line); TA, subject 2, 0+ 2−, 11 Hz, 5 V (solid line) and subject 8, c+ 3−, 11 Hz, 4 V (dashed line); and TS, subject 2, 0+ 2−, 11 Hz, 5 V. Waveforms are presented amplitude matched.