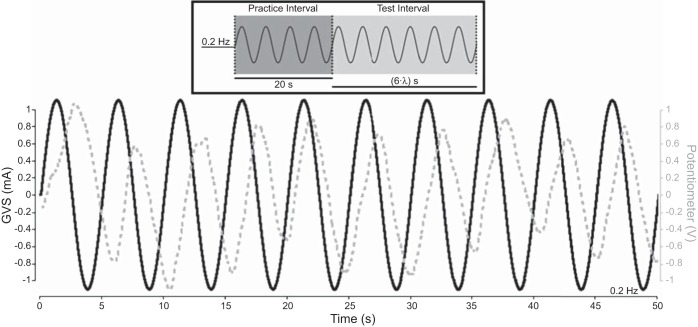
Fig. 3.
Sample manual tracking trial timeline. Within 1 or 2 stimulus cycles, participants began moving the potentiometer at a consistent phase relative to the stimulus. For the virtual and real manual tracking experiments, each trial consisted of a 20-s practice interval in which participants began moving the potentiometer, followed immediately by 6 cycles of the test stimulus (test interval). In this example, the stimulus frequency was 0.2 Hz (λ = 5 s); therefore, the test interval duration was 30 s (see inset). Data from 3 test intervals at each frequency were concatenated together in the analysis.

