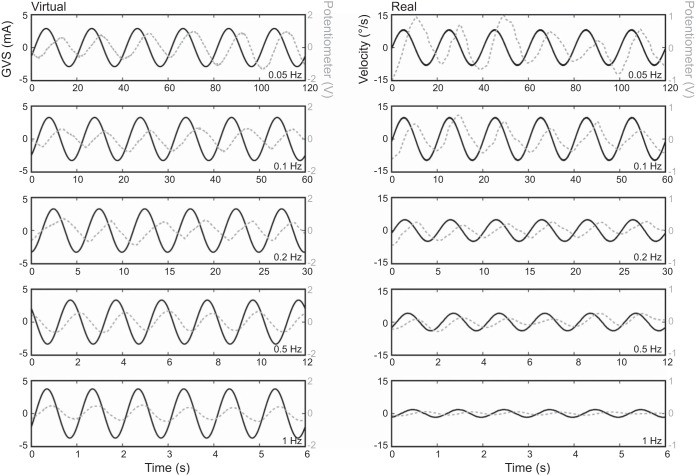
Fig. 6.
Representative manual tracking data for virtual and real sinusoidal rotations. GVS/encoder velocity (solid black) and potentiometer voltage (dashed gray) are plotted together on the same timescale. Note that the potentiometer traces illustrated are raw signals; however, these signals were differentiated for all analyses. Left: virtual rotations. Right: real rotations. Different stimulation frequencies are plotted in each row.

