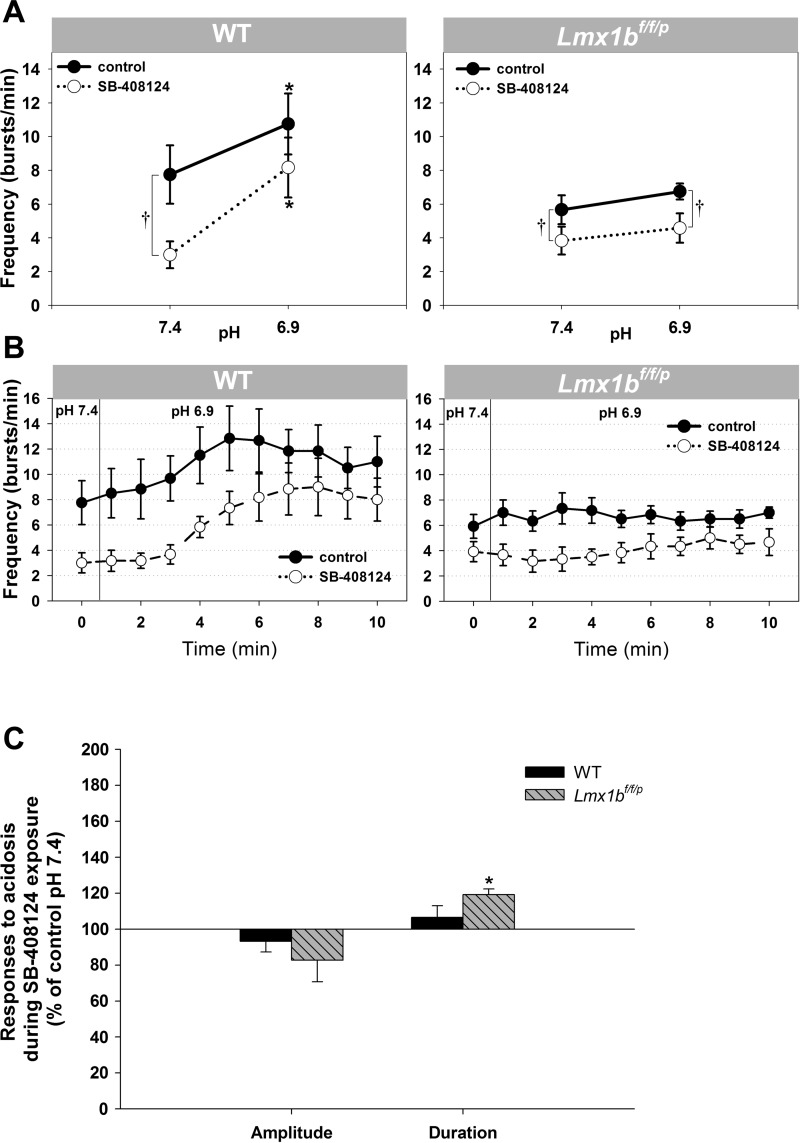
Fig. 4.
Hypoglossal nerve response to pH 6.9 and the impact of an hcrt-r1 antagonist on this response in WT and Lmx1bf/f/p preparations. A: application of 3 μM SB-408124 (○) compared with control (●). Data are means ± SE. *P < 0.05 indicates a statistically significant difference from values at pH 7.4. †P < 0.05 indicates a significant difference between control and SB-408124 (2-way RM ANOVA) from values at pH 7.4. B: time course of burst frequency in each genotype, both with (○) and without (●) SB-408124 in the perfusate, during control pH conditions (pH 7.4) and during acidosis (pH 6.9). C: hypoglossal nerve burst duration and amplitude responses to acidosis in WT and Lmx1bf/f/p preparations during exposure to SB-408124. Data are means ± SE expressed as a percentage of control pH 7.4 values. A paired t-test was used to determine statistical significance of values at pH 6.9 (in the presence of SB-4081240) compared with control pH 7.4 (also in the presence of SB-408124). *P = 0.001.

