Fig. 1.
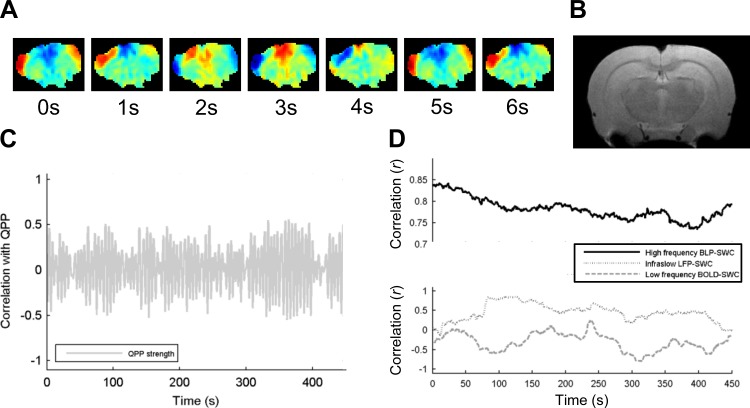
Examples of the dynamics generated in this study. A: quasi-periodic patterns (QPP) template, generated with the algorithm from Majeed et al. (2011). Every 4th frame is shown; range is approximately from −1 for dark blue to +1 for dark red. Notice that an alternating positive/negative wave moves from the ventral-lateral to dorsal-medial cortex. B: anatomical MRI rat brain image in the same plane as A, for comparison. C: the strength of the QPP, over time. The higher points are where the resting state functional magnetic resonance imaging (rsfMRI) signal is spatiotemporally similar to the pattern in A, and the low points are where it is not. Notice that there are periods of stronger and weaker periodicity. D: examples of sliding window correlation (SWC) calculated from the high-frequency band-limited power (BLP; solid line, changes are smaller than others in terms of absolute r values), the infraslow (low-frequency) local field potential (LFP; thin dashed line) and the infraslow blood oxygenation level dependent (BOLD) signal (thick dashed line). Notice that correlation changes dynamically over time, with some similarities between the three time courses.

