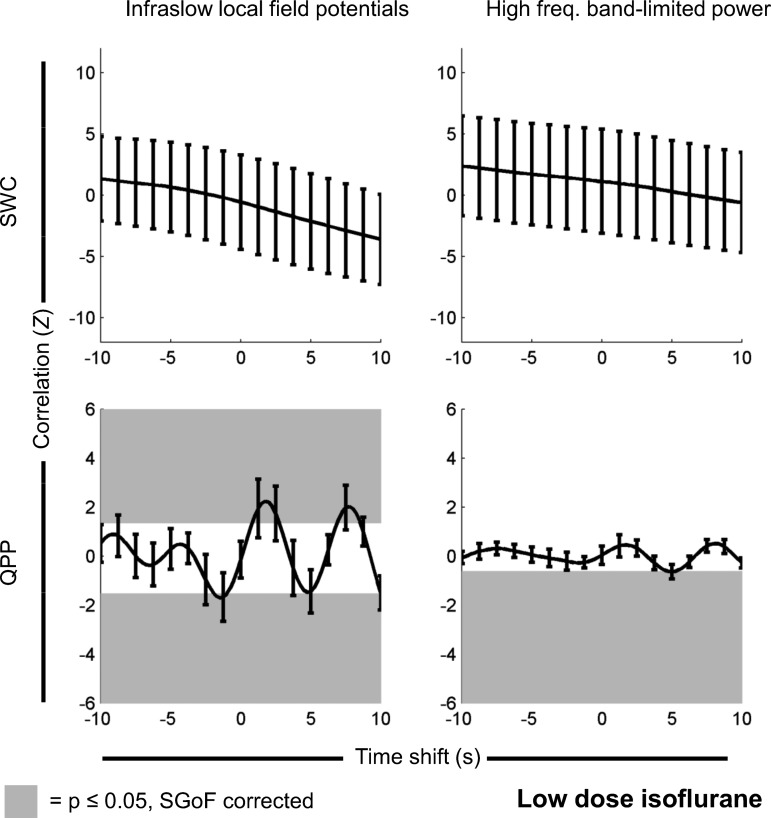
Fig. 2.
Correlation between dynamic rsfMRI and electrophysiology-derived signals recorded under a low dose of isoflurane (N = 12 scans). The top row is correlation between the SWC calculated from rsfMRI and SWC either calculated from the infraslow (low-frequency) LFP directly (left) or the high-frequency BLP signal (right). The bottom row is correlation between the strength of the QPP over time (generated from rsfMRI) and either the infraslow (low-frequency) LFP directly (left) or the high-frequency BLP signal (right). The y-axis on each plot is normalized Z value, corresponding to number of standard deviations from the null hypothesis of no correlation. The x-axis on each plot is the time shift between electrophysiology and rsfMRI-derived measures, with positive indicating that electrophysiology events precede rsfMRI events and negative indicating that rsfMRI events precede electrophysiology events. Significant Z values have a gray background. If no gray background is present, then nothing passed multiple comparison corrections [using sequential goodness of fit (SGoF)]. Error bars are 1 SE of the mean. Under a low dose of isoflurane, there is significant correlation between the change in QPP strength over time and the infraslow LFP signal, as well as a significant correlation between the change in QPP strength over time and the high-frequency BLP signal (note that, as only one point is significant, the line of correlation vs. time shift is only tangent to the significance zone at that point). Note that, for QPP, time shifts are arbitrary, and positive and negative correlations are expected (see Significance of QPP correlation vs. time shift in materials and methods). Partial correlation results (with SWC acting as a controlling variable for QPP strength vs. electrophysiology correlations and QPP strength acting as a controlling variable for SWC vs. electrophysiology correlations) had no statistically significant differences and appeared identical when plotted.

