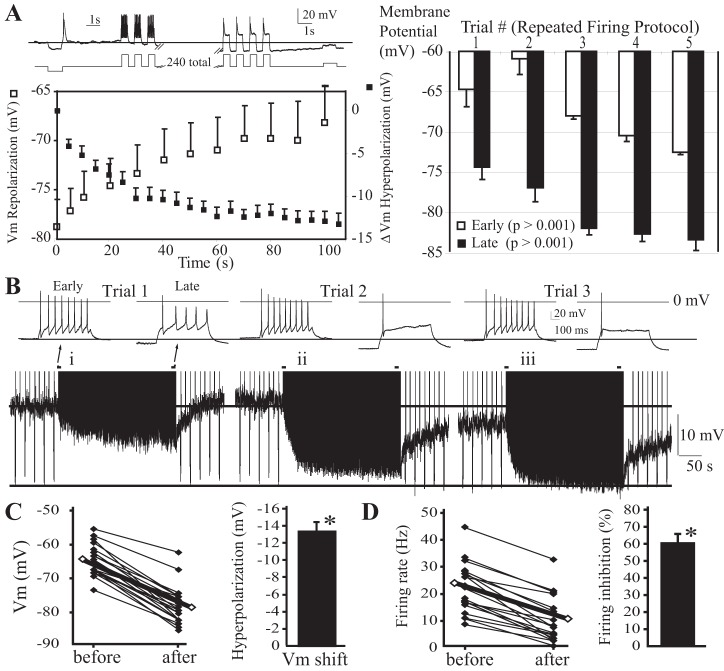
Fig. 1.
Kinetics and plasticity of centromedial (CM) thalamocortical neuron autoinhibition. A: diagram of pulse protocol (top) and example of the firing response and membrane potential (Vm) shift. In all traces, a line marks the baseline resting Vm prior to and during stimulation. Left: kinetics of firing-induced Vm hyperpolarization and repolarization. Right: effects of repeated trials of the firing protocol (n = 8). Means ± SE are plotted. B: traces revealing the effects of repeated trials of the firing protocol. A second line marks the most hyperpolarized Vm achieved with repeated stimulation. Inset: repeating the protocol also potentiated the firing rate inhibition. Traces at baseline (early) and stimulated (late) Vm are shown. In the example shown, with the repeated stimulation protocol, the combined persistent and reversible components of hyperpolarization generated a very large hyperpolarization response approaching 20 mV in total. C: action potential firing hyperpolarizes Vm (n = 16). D: action potential firing inhibits firing frequency (n = 16). *P < 0.05.

