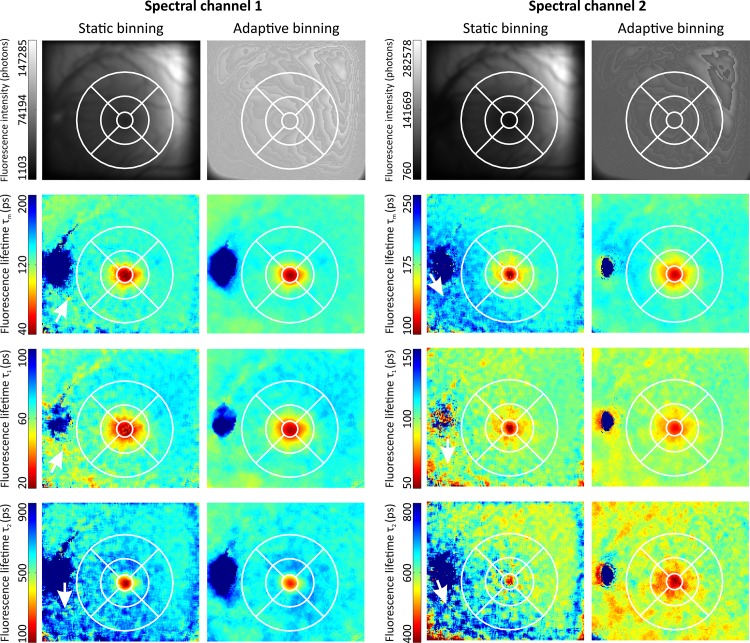
Fig 7. Comparison of static and adaptive binning in a diabetes mellitus patient without diabetic retinopathy.
The images (149 x 169 pixels, 59 x59 μm2/pixel) of the fluorescence intensity, the fluorescence lifetimes τm, τ1, and τ2 are shown in the rows from top to bottom. The columns are static binning and adaptive binning for both spectral channels respectively. The fluorescence lifetimes were determined using the lens-corrected approach (Eq 8), with two exponential functions, ß set to 1 and a separate crystalline lens measurement. The color scaling is identical for the fluorescence intensity and the fluorescence lifetimes in each spectral channel for better comparison. The ETRS grid is drawn on each subplot for orientation. The low amount of detected fluorescence photons in the lower left part of the image causes a prolongation of especially fluorescence lifetimes τ2 in both spectral channels as well as the average fluorescence lifetime τm in spectral channel 2 in case of static binning. The largest differences are highlighted by white arrows.

