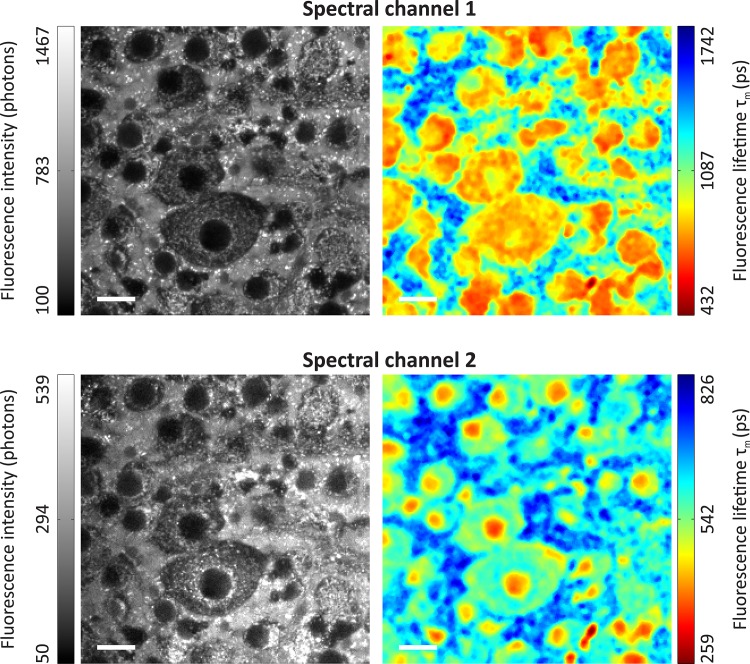
Fig 11. Fluorescence intensity and average fluorescence lifetime of the ganglion cell layer in a porcine retina ex vivo sample.
The 256 x 256 pixels images (34 x34 μm2/pixel) of the fluorescence intensity before binning (left) and the average fluorescence lifetime τm (right) of the ganglion cell layer in a porcine retina sample are shown in two spectral channels (top: 500–560 nm; bottom: 560–700 nm). Adaptive binning with a threshold of 10,000 photons per pixel was applied. A multi-exponential model with two exponential functions was used to determine the fluorescence lifetimes. The length of the white bar is 20 μm.

