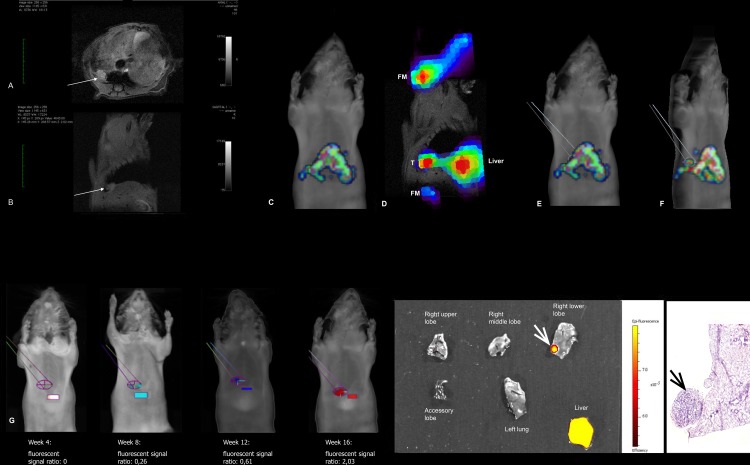
Fig 3. Retrospective analysis of the MMPSense680 fluorescent signal following identification of the tumor on fused FMT-MRI images.
A representative example of one animal, from imaging to histology, is presented. A&B) Axial and sagittal MRI scans, showing a small tumor (white arrows) in the right lower lobe of the lung, behind the liver (L). C) Frontal view of the FMT scan. The tumor is hidden behind the strong fluorescent signal of the liver. D) Overlay of the FMT signal on the MRI image, using the fiducial markers (FM) and the liver (L) for 3D alignment. Note the distinct fluorescent signal localized to the tumor (T). E&F) The position of the tumor was identified on the FMT scan and the corresponding region of interest was circumscribed (E: frontal view of the FMT scan; F: oblique view of the same FMT scan. G) The tumor ROI (ellipse) was reported on the previous FMT scans of the same animal, along with a liver ROI (rectangle) to allow fluorescence ratio quantification, showing an increasing fluorescence with time. The effect of probe activation in the liver on measurements of this tumor—near the liver—cannot be measured. H&I) Ex-vivo epifluorescence imaging (H) and histological reviews (I) confirmed the presence of a 2mm adenoma in the right lower lobe (white and black arrows).

