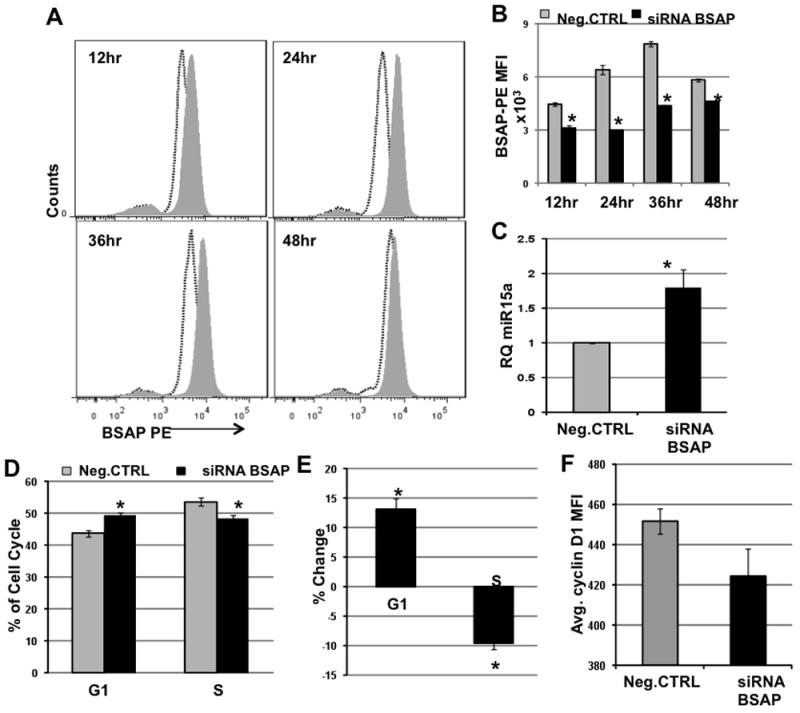
Fig. 5. BSAP Knockdown Leads to Increased miR-15a/16-1 and Cell Cycle Arrest in vitro.

3ug siRNA BSAP or non-targeting siRNA (Neg.CTRL) was transiently transfected into the murine NZB CLL cell line LNC and analyzed at the indicated time-points. A) Representative histogram overlay of cells transfected with either siRNA BSAP (black dotted line) or with Neg.CTRL (Grey filled) and stained with BSAP-PE antibody. B) The BSAP MFI ± SEM at indicated time-points post transfection with siRNA BSAP (Black bar) or with Neg.CTRL (Grey Bar). n=3, *p<0.05, C) Average miR-15a levels 24hr post-transfection, n=6, *p<0.05 D) Percentage of cells in the G1 and S phase of the cell cycle at 36hr post-transfection. n=7, *p<0.01. E) Percent change in cells in G1 phase and S phase, 36hr post-transfection. Percent Change = [(%G1 or %S in siRNA BSAP group − %G1 or %S in Neg.CTRL group)/(%G1 or %S in Neg.CTRL group)]*100. n=7, *p<0.01, large effect size. F) Decrease in the CyclinD1 MFI in the siRNA BSAP group in relation to the Neg.CTRL group, 24hr post transfection. n=3. Statistics employed: Two-tailed paired Student’s t test.
