
Figure 1. Effects of Diagnostic Group on Degree Centrality.
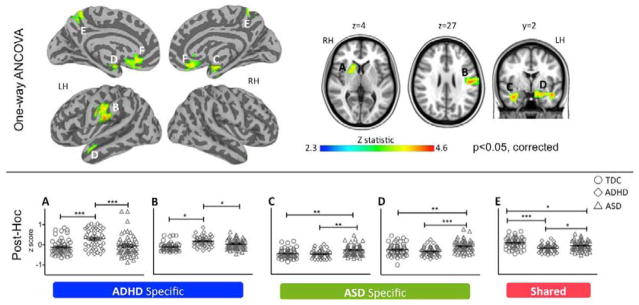
The top panel depicts the statistical brain maps of the F-contrast results from the one-way ANCOVA revealing voxels in which degree centrality (DC) z scores differ as a function of group (Typically Developing Children [TDC] vs. Attention-Deficit/Hyperactivity Disorder [ADHD] vs. Autism Spectrum Disorders [ASD]). Gaussian random field theory was employed to carry out cluster-level correction for multiple comparisons (min Z > 2.3; cluster significance: p < 0.05, corrected). Significant clusters are presented on inflated surface maps (left side) and axial and coronal maps (right side) generated using Analysis of Functional NeuroImages (AFNI) and Surface Mapping with AFNI (SUMA) software (http://afni.nimh.nih.gov/afni/suma). Lateral and medial views are shown for left and right hemispheres (LH, RH, respectively). For illustration purposes, results were resampled from 4mm3 to 1mm3 using sinc interpolation (FLIRT). The scatter plots in the bottom panel illustrate individual participant z scores, for the five clusters (indexed with capital letters from A to E) in which ASD, ADHD, or both differed from TDC, based on pair-wise post-hoc group comparisons (Tukey corrected at p< 0.05). Solid black lines depict means and standard errors. Horizontal capped lines designate pairwise comparisons reaching statistical thresholds: ***, p<0.0001; **, p<0.001; and *, p<0.05. ADHD specific clusters A and B designate regions in which ADHD differ from both TDC and ASD; ASD specific clusters C and D designate regions in which ASD differ from both TDC and ADHD; Cluster E designates a region in which both clinical groups exhibited decreased DC relative to TDC. Figure S5 in Supplement 1 shows cluster F, in which ASD and ADHD differed from each other, although neither differed from TDC. See Table S2 in Supplement 1 for anatomical labels, group statistics and peaks detected within clusters.