
Figure 2. Contributions of ADHD-Like Comorbidity to ASD-Related Differences in Degree Centrality.
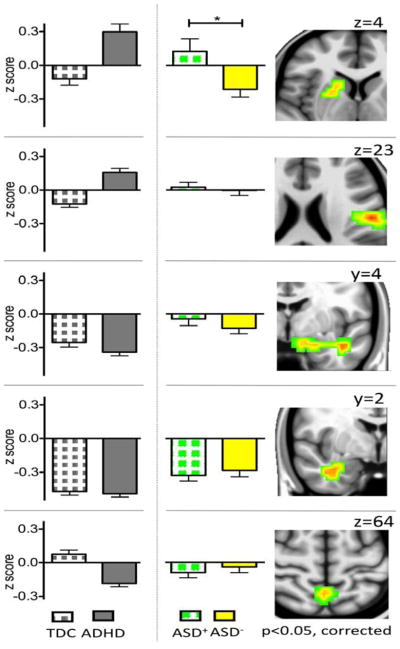
Histograms illustrate degree centrality (group mean z scores and standard errors of the mean) in children with Autism Spectrum Disorders (ASD) with and without Attention-Deficit/Hyperactivity Disorder (ADHD) comorbidity (ASD+ and ASD−, green squares and yellow fill, respectively). For illustration, we also present the histograms for children with ADHD and Typically Developing Children (TDC). With respect to degree centrality, ASD+ and ASD− differ significantly only in a cluster encompassing the right striatum and pallidum (See Table S3 in Supplement 1 for group statistics). The right panels show the coronal and axial brain images depicting the statistical maps of the five clusters identified in primary analyses. From the top, these are the right striatum/pallidum (z=4), the left postcentral cortex (z=23), the left (y=4) and right (y=2) temporolimbic areas, and the precuneus (z=64) (min Z > 2.3; cluster significance: p < 0.05, corrected). Brain maps were generated using Analysis of Functional NeuroImages (AFNI) (http://afni.nimh.nih.gov/afni). For illustration purposes, results were resampled from 4mm3 to 1mm3 using sinc interpolation (FLIRT). *p=.017.