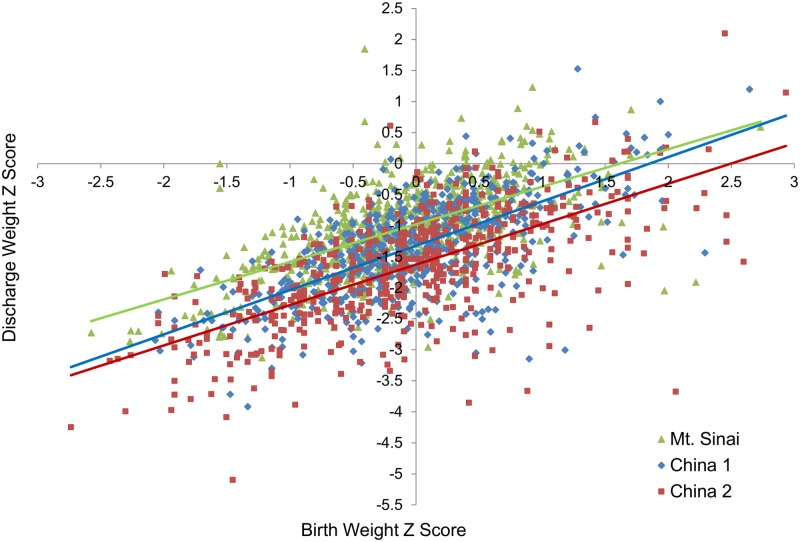
Fig 1. Discharge weight Z score as a function of birth weight Z score for all three NICUs.
The regression lines for the three NICUs are for Mount Sinai, y = 0.61x–0.98 (R2 = 0.36, p<0.001); for China 1, y = 0.71x–1.32 (R2 = 0.44, p<0.001); and for China 2, y = 0.65x–1.62 (R2 = 0.44, p<0.001). Thus, the y intercepts for all three NICUs are <0 and the slopes for all three NICUs are <1, reflecting EUGR.

