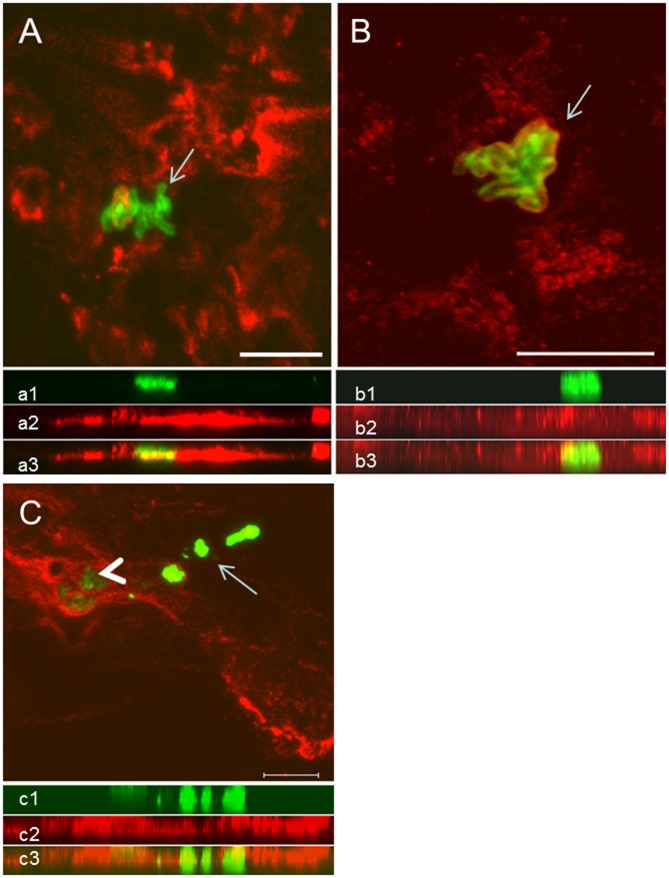
Fig 4. Colocalization analysis of NETs and amastigotes by confocal microscopy.
(A) NETs containing neutrophil elastase (red) and amastigotes (green, arrow). (B) NETs containing histone (red) and amastigotes (green, arrow). (C) Area enclosing intact amastigotes (green—arrowhead) in intimate contact with NETs labeled with anti-neutrophil elastase (red). Area containing free Leishmania sp antigens (arrow). Below each image the respective side view (Z images) of (a1, b1, c1) amastigotes (green), (a2, c2) NET-elastase, (b2) NET-histones, merged sections showing the close contact between amastigotes and NETs (a3, b3, c3). Scale bar = 10μm.

