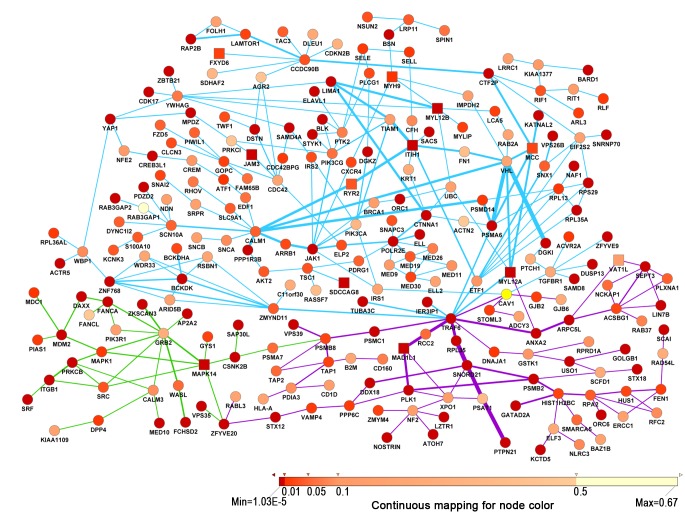
Fig 1. Protein-protein interaction network involving all merged module genes.
Square nodes denote the reported genes associated with schizophrenia or bipolar disorder. The color of the node was proportioned with the P-value of gene. The width of the edge was proportioned with the No. of repeats of the edge in the modules. The purple edges, green edges and blue edges were interactions from MGS, Affy6 and Affy500K respectively.

