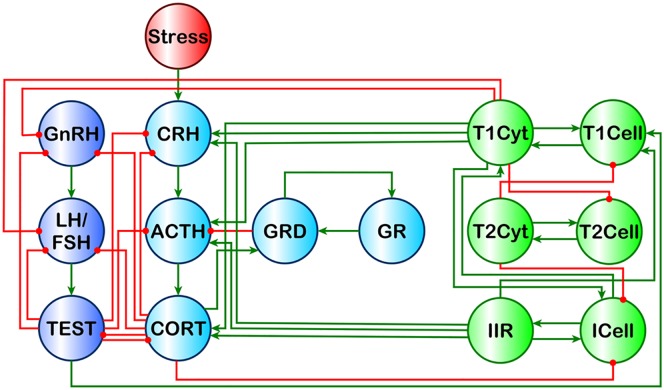
Fig 2. Theoretical Male HPA-HPG-Immune Signaling Network.
Light blue nodes denote the HPA axis model described by Gupta et al., 2007 [14]. Dark blue nodes denote the male HPG axis. Green nodes denote a simplified immune system originally described in [16]. Red nodes denote external influences on the system. Green edges are stimulatory, and red edges are inhibitory. This image is a reproduction of the original found in [16] and presented under the PLoS ONE Creative Commons Attribution License.

