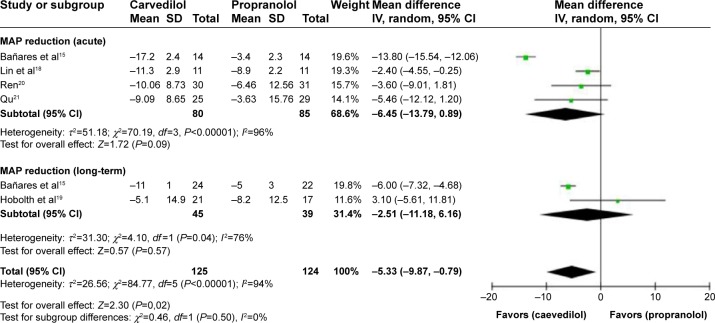
Figure 7.
Subgroup analysis (random-effect model) of the percentage of mean arterial pressure reduction, representing the MDs (rectangles) and 95% CI (horizontal lines) for trials that compared carvedilol and propranolol.
Notes: The size of the rectangles indicates the weight of every trial. The above diamond shows the subtotal MD and 95% CI of the acute drug administration. The below diamond shows the subtotal MD and 95% CI of the long-term drug administration. The heterogeneity test is also performed.
Abbreviations: MD, mean difference; CI, confidence interval; SD, standard deviation; IV, inverse variance; MAP, mean arterial pressure reduction.

