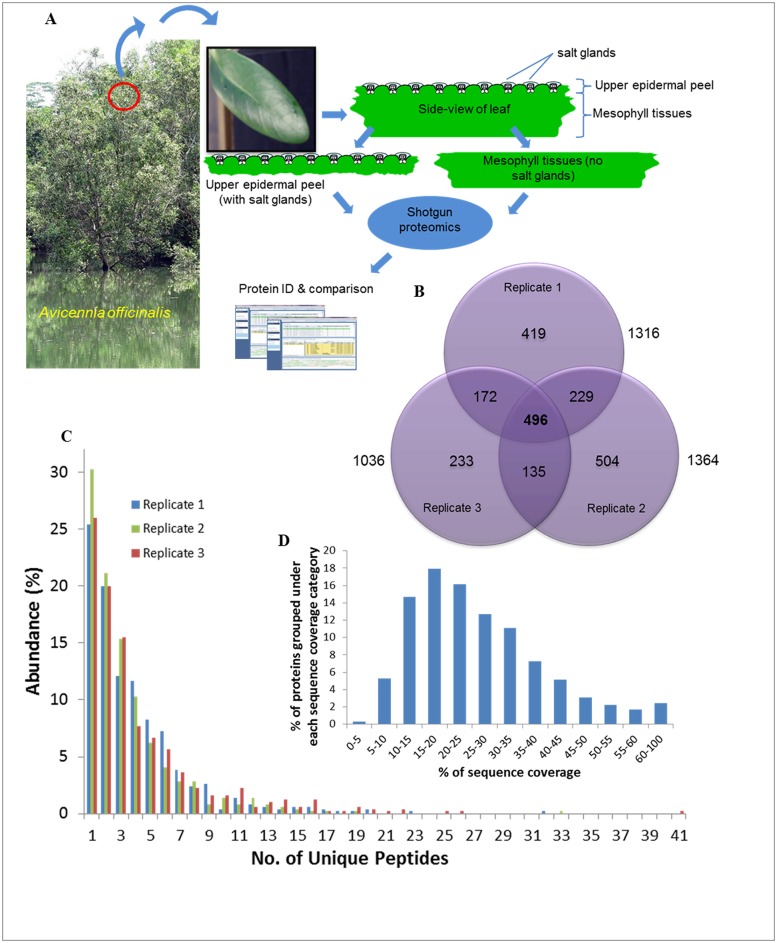
Fig 2. Identification and analysis of salt gland-enriched proteome.
(A) The experimental approach for generation of a salt gland-enriched proteome through the use of two distinct set of samples: total proteins from the adaxial (upper) epidermal peels (with salt glands) and from the mesophyll tissues (no salt glands). (B) The number of proteins that are identified in salt gland-enriched epidermal peels from three biological replicates is presented in the Venn diagram. Identified proteins from the salt gland-enriched tissues that were present in all the three biological replicates were grouped according to the number of unique peptides (C) and % sequence coverage (D). The identified proteins (D) were classified according to the protein’s sequence coverage.

