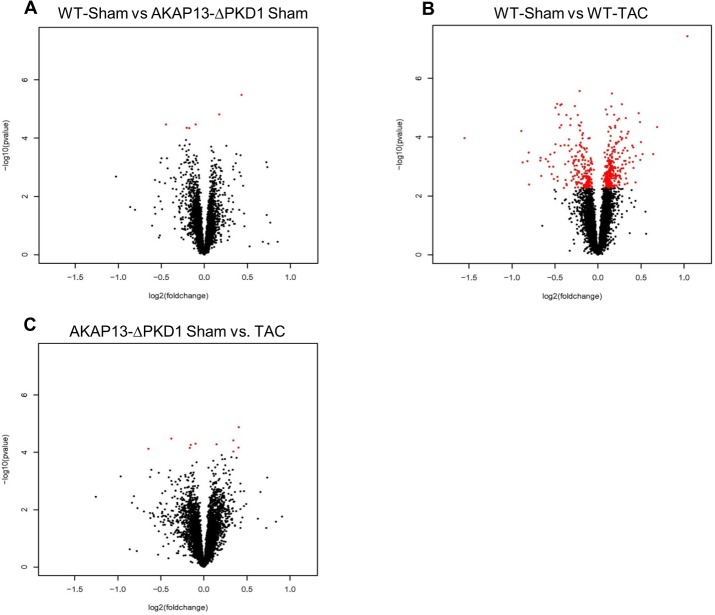
Fig 1. Volcano plot comparative expression analysis of WT and AKAP13-∆PKD1 Sham and TAC mice.
The x-axis is the fold-change and the Y-axis is p-value in–log10 scale computed using program R. A) The expression of 6 genes were significantly changed in AKAP13-∆PKD1 sham mice compared to wild type sham mice, 4 genes were down-regulated (Crsp 3, Prkab1, Rccd1, and Zfp592) and 2 were up-regulated (Sertad 3 and Lrtm1). Red dots indicate significant changes in gene expression while black dots are not significant. B) The expression of 479 probes was significantly changed (>2.5-fold) in WT-TAC mice compared to WT-Sham mice (p<0.05). A total of 204 probes were up-regulated and 275 were down-regulated. C) The expression of 10 probes were significantly changed (>2.5-fold) in AKAP13-∆PKD1-TAC mice compared to AKAP13-∆PKD1 sham mice (p<0.05). A total of 5 probes were up-regulated and 5 were down-regulated.

