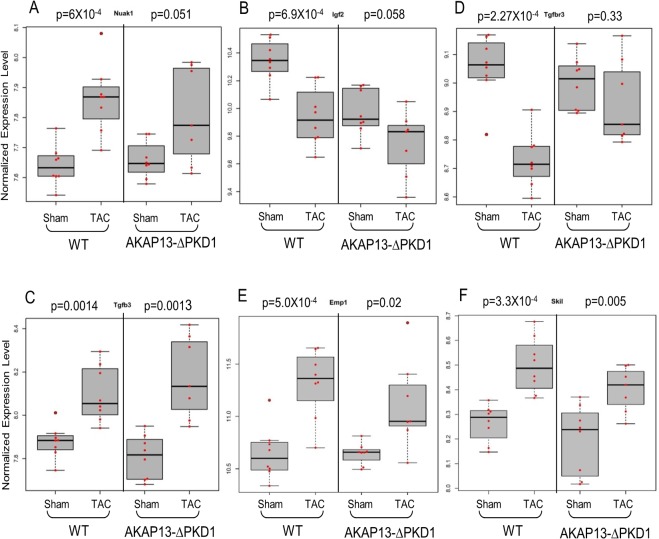
Fig 10. Cell Growth/Differentiation Gene expression stratified by WT or AKAP13-∆PKD1 mice following sham or TAC surgery.
Normalized gene expression is shown for cellular growth and differentiation genes A) Nuak1, B) Igf2, C) TgfβR-3 D), Tgfβ-3 E), Emp1 and F) Skil. Gray boxes represent the interquartile range, encompassing the first through third quartiles; the horizontal bar shows the median value. Values greater than 1.5 times the interquartile range are plotted outside of the whiskers. P values are from linear regression assuming an additive model.

