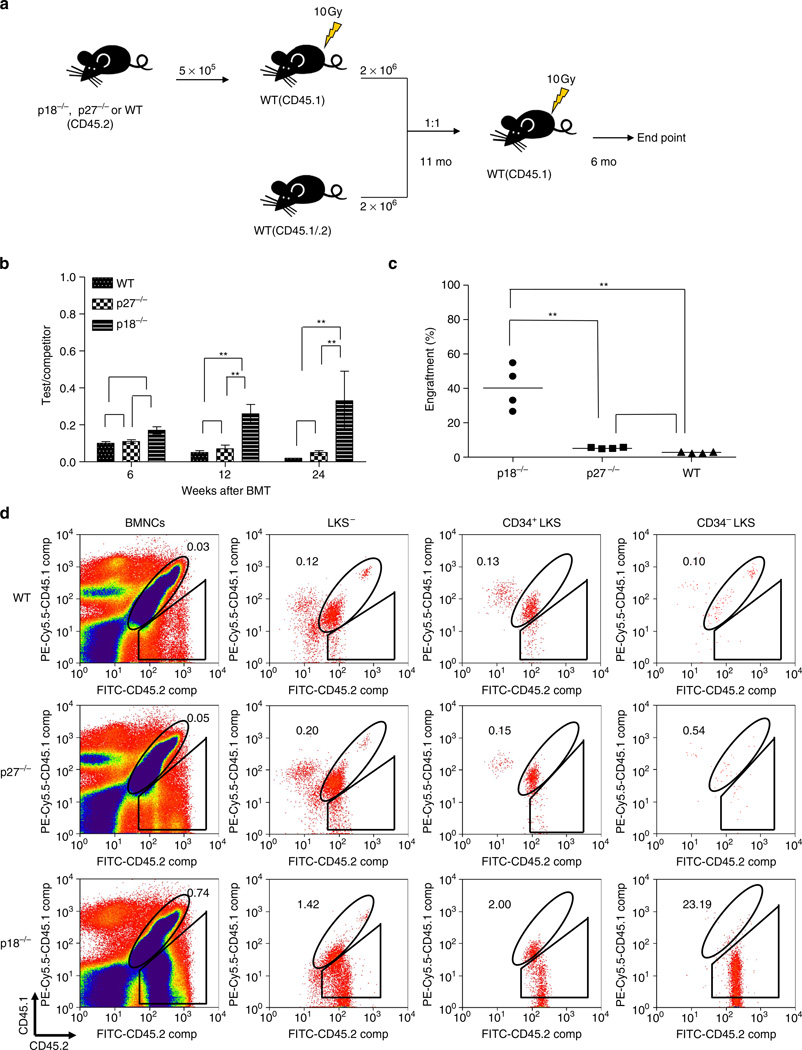
Figure 1. cBMT using knockout versus wild-type cells.
(a) Experimental design of the bone marrow transplantation study. 5 × 10⁶ p18−/−, p27−/− or wild-type BMNCs (CD45.2+) were injected into recipients of CD45.1 backgrounds. Eleven months (mo) after BMT, all recipients were fully reconstituted by donor-derived haematopoiesis. We then challenged transplanted HSCs (pooled from primary recipients) with an equal number (2 × 10⁶) of un-manipulated wild-type BMNCs and transplanted them into secondary recipients (n = 10). Reconstitution levels in secondary recipients were assayed for 6 months, after which the recipients were killed and subjected to flow cytometry to analyse multi-lineage haematopoietic development. (b) The ratio of test versus competitor cells. The Student’s t-test was used to compare the difference among the three groups (n = 10) at different time points. (c) Overall engraftment levels in BM of secondary recipients. Only p18−/− re-transplanted HSCs reconstituted the host robustly (P < 0.01, n = 4). (d) Relative representation in haematopoietic stem/progenitor subsets. These panels show the contribution of both transplanted HSCs and un-manipulated HSCs at different stages of haematopoiesis. Here, the CD45.2 population was contributed by transplanted cells, whereas double positive populations were contributed by un-manipulated cells. The values in the corner show the ratio of CD45.2 versus double positive cells. In the wild-type group, fresh HSCs dominated at both the progenitor and stem cell level. The CD34− LSK cells are largely responsible for long-term engraftment in transplanted animals. Data sets were analysed using one-way analysis of variance (GraphPad Prism v6.0). All data represent mean ± s.d. *P < 0.05, **P < 0.01.

